

|
시장보고서
상품코드
2124579
구독 결제 관리 : 시장 점유율 분석, 업계 동향 및 통계, 성장 예측(2026-2031년)Subscription Billing Management - Market Share Analysis, Industry Trends & Statistics, Growth Forecasts (2026 - 2031) |
||||||
 Mordor Intelligence
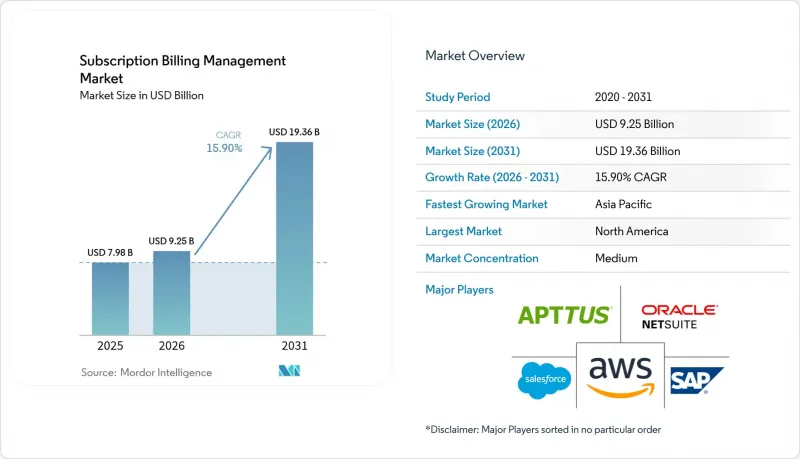
Mordor Intelligence에 의하면, 2026년 구독 결제 관리 시장 규모는 92억 5,000만 달러로 추정되고 2025년 79억 8,000만 달러에서 성장하여 2031년에는 193억 6,000만 달러에 이를 것으로 예측됩니다.
2026년부터 2031년까지의 연평균 성장률(CAGR)은 15.9%를 나타낼 전망입니다.
본 보고서는 구성 요소(소프트웨어, 서비스), 배포 방식(On-Premise, 클라우드), 기업 규모(대기업, 중소기업), 최종 사용자 산업(소매 및 전자상거래, 은행, 금융서비스 및 보험(BFSI), IT 및 통신, 미디어 및 엔터테인먼트 등), 지역(북미, 유럽 등)별로 분류되어 있습니다. 시장 전망은 금액(달러) 기준으로 제시되어 있습니다.
세계의 구독 결제 관리 시장 동향 및 인사이트
'As-a-Service'를 통한 수익화가 통신 업계의 수익 다각화를 가속화하고 있습니다.
각 통신 그룹사는 5G 연결을 엔터테인먼트, IoT, 엣지 컴퓨팅 번들과 결합하고, 통합된 과금 엔진을 활용하여 다자간 수익 분배 및 하이브리드 이용료와 구독 요금의 조정을 수행하고 있습니다. T-Mobile의 Netflix 포함 요금제나 Verizon의 엔터테인먼트 번들은 경험 중심의 서비스로의 전환을 여실히 보여주고 있습니다. 모듈형 플랫폼은 과금 계산, 중개, 파트너와의 결제를 자동화하여 현금화까지의 시간을 단축하고, 예측 가능한 현금 흐름을 뒷받침하는 동시에 마이크로서비스 실험을 가능하게 합니다. Evergent사의 ‘Digital Commerce Bridge’와 같은 신흥 도구를 통해 통신 사업자는 프로모션과 업셀링을 동적으로 결합할 수 있게 되어, 사용자 1인당 평균 수익(ARPU)을 확대할 수 있습니다.
사용량 기반 과금제는 클라우드 인프라의 경제성을 혁신하고 있습니다.
AWS, Azure, Google Cloud는 종량제를 표준화했으며, 이에 따라 기업 고객들은 분 단위 측정, 임계값 기반 알림, 사용 후 청구서를 요구하게 되었습니다. Snowflake가 사용량 연계형 계약으로 성공을 거둔 것은 고객의 사용량이 제공되는 가치와 발맞추어 확대될 때 발생하는 수익의 플라이휠 효과를 여실히 보여줍니다. 최신 과금 시스템은 수십억 건의 이용 이벤트를 처리하고, 단계별 가격이나 버스트 요금을 적용하며, 지역을 초월한 세금 정산을 실시간으로 수행합니다. 각 벤더사는 초기 계약 금액 인하로 인해 구매 시 진입 장벽이 낮아졌고, 데이터 기반 가격 곡선에 업셀링 경로가 통합됨에 따라 고객 유지율 향상을 보고하고 있습니다.
결제 사기의 급증으로 국경을 초월한 구독 모델이 위협받고 있습니다.
2023년 전 세계 부정 거래로 인한 손실액은 4,850억 달러에 달했으며, 소비자가 언뜻 보면 정당해 보이는 송금을 승인하도록 속이는 ‘승인된 푸시 결제 사기’가 급증하고 있습니다. 구독 서비스 사업자는 마찰 없는 갱신 절차와 강력한 부정 방지 대책 간의 균형을 맞추어야 합니다. 이를 위해서는 AI를 활용한 패턴 인식 도구에 투자하여 오탐을 줄이고 고객의 신뢰를 유지해야 합니다. 영국의 환불 의무화 등 규제 대응으로 인해 책임이 결제 사업자에게 전가됨에 따라, 적응형 리스크 엔진 및 네트워크 전반의 이상 감지에 대한 투자가 가속화되고 있습니다.
부문별 분석
클라우드 도입은 2025년 매출의 75.35%를 차지했으며, 유지보수 부담을 줄여주는 자동 스케일링 및 전 세계적으로 분산된 과금 엔진에 대한 수요에 힘입고 있습니다. 클라우드 도입에 따른 구독 결제 관리 시장 규모는 2031년까지 연평균 성장률(CAGR) 18.05%로 확대되고 있으며, 이는 퍼블릭 클라우드 보안 인증에 대한 기업의 신뢰와 사용량 기반 비용 구조의 매력을 반영합니다. 완전 관리형 서비스로 제공되는 ‘Stripe Billing’은 주요 기술 기업에 정밀한 과금 측정 및 자동 대조 기능을 제공함으로써 연간 매출액 5억 달러를 돌파했습니다. 데이터 상주성 보장이 요구되는 규제가 엄격한 업계에서는 여전히 On-Premise 도입이 남아 있지만, 암호화 기술의 향상과 프라이빗 클라우드 선택지 증가로 인해 이 틈새 시장은 축소되고 있습니다.
주간 릴리스 주기, 다운타임 제로 업그레이드, 40개 이상의 결제 게이트웨이와의 네이티브 연동을 위한 벤더의 노력이 마이그레이션의 기세를 뒷받침하고 있습니다. 기밀 데이터를 프라이빗 환경에 보관하면서 요금 산정 및 청구 처리를 클라우드에서 수행하는 하이브리드 아키텍처는 신중한 기업들에게 과도기적인 가교 역할을 하고 있습니다. 클라우드 보급이 확대됨에 따라 각 벤더는 재무 팀이 이용 관련 모든 이벤트를 발생 원천부터 청구서 발행까지 추적할 수 있는 가시성 도구에 대한 투자를 확대하고 있으며, 이를 통해 감사 위험을 완화하고 서번스-옥슬리법 준수를 지원하고 있습니다.
2025년에는 플랫폼 소프트웨어가 매출 점유율의 79.40%를 유지하며, 핵심적인 계량, 요금 산정, 수익 관리 기능을 제공했습니다. 한편, 기업들이 자문, 통합 및 관리형 운영 지원을 요구함에 따라 서비스 부문은 연평균 성장률(CAGR) 19.05%로 성장하고 있습니다. 각 벤더는 가치 실현까지의 시간을 단축하기 위해 액셀러레이터 키트, 사전 구축된 커넥터, 규제 변경 대응 팩을 번들로 제공하고 있으며, 한편 파트너 기업들은 DevOps 워크플로우에 과금 로직을 통합하는 ‘구성-as-코드(Configuration-as-Code)’ 파이프라인을 운영하고 있습니다.
컨설팅 업무에는 가격 모델 설계, 시장 출시 준비, 수익 인식(RevRec) 규정 준수가 포함되지만, 이는 재무 팀이나 제품 팀이 전문 인력을 충분히 확보하지 못하고 있는 분야입니다. 로우코드 기반 구성 및 컴포저블 API의 부상으로 대상 수요가 확대되고 있지만, 기업이 단계별 구독과 사용량 초과분, 그리고 채널 리셀러의 마진을 결합하면 복잡성이 급증합니다. 이 서비스 분야의 상승 추세는 구독 결제 관리 시장에서의 성공이 소프트웨어 기능의 폭과 마찬가지로 해당 분야의 전문 지식에 크게 의존하고 있음을 보여줍니다.
지역별 분석
북미는 성숙한 SaaS 보급률, 확립된 카드 네트워크, 그리고 일회성 매출보다 연간 반복 매출(ARR)을 중시하는 투자자 생태계에 힘입어 전 세계 매출의 39.60%를 차지하고 있습니다. 이 지역의 규제 환경은 실험적인 시도를 뒷받침하고 있습니다. 캘리포니아주 소비자 개인정보 보호법(CCPA)은 특정 과금 아키텍처를 규정하지 않고 동의 요건을 명확히 함으로써, 벤더가 자유롭게 혁신을 펼칠 수 있도록 하고 있습니다. Stripe, Zuora, Chargebee와 같은 미국의 주요 기업들은 자사 플랫폼을 전 세계에 확장하고 있으며, Stripe Billing만 해도 Atlassian과 OpenAI의 구독 처리를 담당하고 있습니다.
아시아태평양은 연평균 성장률(CAGR) 21.05%로 가장 빠르게 성장하고 있는 지역입니다. 결제 혁신, 특히 인도의 UPI와 싱가포르의 PayNow는 거래 비용을 절감하고, 1달러 미만의 단위로 지갑에서 자동 이체되는 마이크로 구독 모델을 뒷받침하고 있습니다. 아세안(ASEAN) 국가 정부들은 국경을 초월한 QR 코드 프레임워크 조정과 데이터 보호법 조화를 도모하고 있으며, 이에 따라 전 세계 사업자들이 이 지역 내에서 서비스를 확장하는 움직임이 가속화되고 있습니다. 중국의 국내 기술 스택은 전자상거래, 스트리밍, 게임 내 경제에 걸친 방대한 구독 생태계를 뒷받침하고 있지만, 공급업체는 세무, 청구, 데이터 호스팅 체계를 현지 상황에 맞게 조정해야 합니다.
유럽은 PSD2-SCA 및 향후 시행될 EU 데이터법을 통해 규정 준수 기준 수립에 있어 매우 중요한 역할을 계속하고 있습니다. 이 법의 주권 조항은 EU 역외에서도 아키텍처 결정에 영향을 미치고 있습니다. 미국 공급업체의 도입 비용은 220억-500억 달러로 예상되며, 이로 인해 분산형 데이터 스토리지 노드 및 설정 가능한 데이터 공유 대시보드로의 전환이 촉진되고 있습니다. 라틴아메리카, 중동 및 아프리카와 같은 신흥 지역은 절대 금액 면에서는 뒤처져 있지만, 모바일 보급률 상승과 실시간 결제 인프라의 성숙에 따라 두 자릿수 성장률을 기록하고 있습니다.
기타 혜택 :
- 엑셀 형식 시장 예측(ME) 시트
- 3개월간의 애널리스트 지원
자주 묻는 질문
목차
제1장 서론
제2장 조사 방법
제3장 주요 요약
제4장 시장 구도
제5장 시장 규모 및 성장 예측
제6장 경쟁 구도
제7장 시장 기회 및 향후 전망
KTH 26.09.14According to Mordor Intelligence, subscription billing management market size in 2026 is estimated at USD 9.25 billion, growing from 2025 value of USD 7.98 billion with 2031 projections showing USD 19.36 billion, growing at 15.9% CAGR over 2026-2031.
This report is Segmented by Component (Software, Services), Deployment Mode (On-Premise, Cloud), Enterprise Size (Large Enterprises, Small and Medium Enterprises), End-User Industry (Retail and E-Commerce, BFSI, IT and Telecom, Media and Entertainment, and More), and Geography (North America, Europe, and More). The Market Forecasts are Provided in Terms of Value (USD).
Global Subscription Billing Management Market Trends and Insights
As-a-Service monetization accelerates telecom revenue diversification
Telecom groups are pairing 5 G connectivity with entertainment, IoT, and edge-compute bundles, using unified billing engines to orchestrate multi-party revenue splits and hybrid usage plus subscription fees. T-Mobile's Netflix-inclusive plans and Verizon's entertainment bundles illustrate the pivot to experience-centric offerings. Modular platforms cut time-to-cash by automating rating, mediation, and partner settlement, supporting predictable cashflows while enabling micro-services experimentation. Emerging tools such as Evergent's Digital Commerce Bridge allow operators to layer promotions and upsells dynamically, widening average revenue per user.
Consumption-based pricing transforms cloud infrastructure economics
AWS, Azure, and Google Cloud normalised pay-as-you-use billing, prompting enterprise clients to demand minute-level metering, threshold-based alerts, and post-usage invoicing. Snowflake's success with usage-aligned contracts illustrates the revenue flywheel effect when customer consumption scales in lockstep with value delivered. Modern billing stacks ingest billions of usage events, apply tiered or burst prices, and reconcile taxes across regions in real time. Vendors report higher customer retention because smaller entry commitments reduce buyer friction, while upsell paths are embedded in data-driven price curves.
Payment-fraud escalation threatens cross-border subscription models
Global fraud losses hit USD 485 billion in 2023, with authorised push-payment scams surging as consumers are tricked into approving legitimate-looking transfers. Subscription merchants must balance frictionless renewal flows with strong anti-fraud layers, funding AI-powered pattern-recognition tools that cut false positives and retain customer trust. Regulatory responses such as the UK reimbursement mandate shift liability to payment firms, intensifying investment in adaptive risk engines and network-wide anomaly detection.
Other drivers and restraints analyzed in the detailed report include:
- EU PSD2-SCA mandates reshape payment authentication standards
- Digital-wallet integration accelerates Asian subscription adoption
- Legacy integration complexity delays enterprise billing modernisation
For complete list of drivers and restraints, kindly check the Table Of Contents.
Segment Analysis
Cloud deployment contributed 75.35% of 2025 revenue, underpinned by demand for auto-scaling, globally distributed billing engines that offload maintenance overheads. The subscription billing management market size for cloud deployment is expanding at an 18.05% CAGR through 2031, reflecting enterprise confidence in public-cloud security certifications and the appeal of usage-based cost structures. Stripe Billing, delivered entirely as a managed service, surpassed a USD 500 million annual run rate by supporting leading technology firms with granular metering and automated reconciliation. On-premise installations persist in highly regulated industries that require data residency guarantees, yet improved encryption and private-cloud options erode this niche.
Migration momentum is reinforced by vendor commitment to weekly release cadences, zero-downtime upgrades, and native integrations with over 40 payment gateways. Hybrid architectures-where sensitive data stays in a private environment while rating and invoicing happen in the cloud-act as transitional bridges for cautious enterprises. As cloud penetration rises, vendors invest in observability tooling that lets finance teams trace every usage event from source to invoice, mitigating audit risk and supporting Sarbanes-Oxley compliance.
Platform software retained 79.40% revenue share in 2025, supplying core metering, rating, and revenue management capabilities. Services, however, are growing at a 19.05% CAGR as enterprises seek advisory, integration, and managed-operations support. Vendors bundle accelerator kits, pre-built connectors, and regulatory change packs to shorten time-to-value, while partners run configuration-as-code pipelines that embed billing logic in DevOps workflows.
Consultative engagements cover pricing-model design, go-to-market readiness, and RevRec compliance, areas that finance and product teams often lack specialist resources for. The rise of low-code configuration and composable APIs widens addressable demand, but complexity spikes when firms blend tiered subscriptions with consumption overages and channel reseller margins. This services uptrend illustrates that success in the subscription billing management market depends as much on domain expertise as on software feature breadth.
Complete Report Scope:
- By Component
- Software
- Services
- By Deployment Mode
- On-Premise
- Cloud
- By Enterprise Size
- Large Enterprises
- Small and Medium Enterprises (SMEs)
- By End-user Industry
- Retail and E-commerce
- BFSI
- IT and Telecom
- Media and Entertainment
- Public Sector and Utilities
- Other End-user Industries
- By Geography
- North America
- United States
- Canada
- Mexico
- Europe
- United Kingdom
- Germany
- France
- Rest of Europe
- Asia-Pacific
- China
- India
- Japan
- South-East Asia
- Rest of Asia-Pacific
- South America
- Brazil
- Argentina
- Rest of South America
- Middle East and Africa
- Middle East
- GCC
- Turkey
- Israel
- Rest of Middle East
- Africa
- South Africa
- Nigeria
- Kenya
- Rest of Africa
- Middle East
- North America
Geography Analysis
North America generates 39.60% of global revenue, buoyed by mature SaaS penetration, established card networks, and an investor ecosystem that rewards annual recurring revenue over one-time sales. The region's regulatory environment encourages experimentation: the California Consumer Privacy Act clarifies consent requirements without prescribing specific billing architectures, allowing vendors to innovate freely. U.S. champions such as Stripe, Zuora, and Chargebee export their platforms worldwide, with Stripe Billing alone processing subscriptions for Atlassian and OpenAI.
Asia-Pacific is the fastest-growing geography at a 21.05% CAGR. Payment innovation, notably India's UPI and Singapore's PayNow, lowers transaction costs and supports micro-subscription models that debit wallets in sub-USD 1 increments. ASEAN governments coordinate cross-border QR frameworks and harmonise data-protection statutes, driving regional rollouts by global merchants. China's domestic technology stack supports vast subscription ecosystems across e-commerce, streaming, and in-game economies, though vendors must localise tax, invoicing, and data-hosting arrangements.
Europe maintains a pivotal role in shaping compliance standards through PSD2-SCA and the forthcoming EU Data Act, whose sovereignty clauses influence architecture decisions even outside the bloc. Implementation costs for U.S. vendors are projected between USD 22 billion and USD 50 billion, encouraging a shift toward distributed data-storage nodes and configurable data-sharing dashboards. Emerging regions in Latin America, the Middle East, and Africa trail in absolute value yet post double-digit growth rates as mobile penetration climbs and real-time payment rails mature.
- Apttus Corporation
- Oracle Corporation (NetSuite)
- SAP SE
- Salesforce.com Inc.
- Amazon Web Services
- Recurly Inc.
- Stripe Inc.
- Paddle.com Market Ltd.
- Chargify LLC (Scaleworks)
- Vindicia Inc.
- BillingPlatform.com
- Gotransverse LLC
- Zuora Inc.
- 2Checkout / Verifone
- Chargebee Inc.
- Zoho Corporation Pvt. Ltd.
- FastSpring
- PayPal Holdings Inc.
- CloudBlue (Ingram Micro)
- Payrix (Worldpay/FIS)
Additional Benefits:
- The market estimate (ME) sheet in Excel format
- 3 months of analyst support
TABLE OF CONTENTS
1 INTRODUCTION
- 1.1 Study Assumptions and Market Definition
- 1.2 Scope of the Study
2 RESEARCH METHODOLOGY
3 EXECUTIVE SUMMARY
4 MARKET LANDSCAPE
- 4.1 Market Overview
- 4.2 Market Drivers
- 4.2.1 Acceleration of as-a-Service monetization in telecom and media in North America drives the market
- 4.2.2 Emergence of consumption-based pricing among cloud infrastructure vendors drives the market
- 4.2.3 Regulatory push for transparent recurring billing under EU PSD2-SCA
- 4.2.4 Digital-wallet and real-time-payment integration driving retail subscriptions in Asia
- 4.2.5 Shift from perpetual licensing to SaaS in industrial software verticals
- 4.3 Market Restraints
- 4.3.1 Rising payment-fraud and charge-back cost in cross-border recurring payments hinders the market
- 4.3.2 Legacy ERP/CRM integration complexity for large enterprises
- 4.3.3 Data-sovereignty rules limiting centralized billing in EU and MEA
- 4.3.4 High switching costs curbing SMB migration from home-grown systems
- 4.4 Value Chain Analysis
- 4.5 Regulatory Outlook
- 4.6 Technological Outlook
- 4.7 Assessment of Macro Economic Trends on the Market
- 4.8 Porter's Five Forces Analysis
- 4.8.1 Bargaining Power of Suppliers
- 4.8.2 Bargaining Power of Buyers/Consumers
- 4.8.3 Threat of New Entrants
- 4.8.4 Threat of Substitutes
- 4.8.5 Intensity of Competitive Rivalry
5 MARKET SIZE AND GROWTH FORECASTS (VALUES)
- 5.1 By Component
- 5.1.1 Software
- 5.1.2 Services
- 5.2 By Deployment Mode
- 5.2.1 On-Premise
- 5.2.2 Cloud
- 5.3 By Enterprise Size
- 5.3.1 Large Enterprises
- 5.3.2 Small and Medium Enterprises (SMEs)
- 5.4 By End-user Industry
- 5.4.1 Retail and E-commerce
- 5.4.2 BFSI
- 5.4.3 IT and Telecom
- 5.4.4 Media and Entertainment
- 5.4.5 Public Sector and Utilities
- 5.4.6 Other End-user Industries
- 5.5 By Geography
- 5.5.1 North America
- 5.5.1.1 United States
- 5.5.1.2 Canada
- 5.5.1.3 Mexico
- 5.5.2 Europe
- 5.5.2.1 United Kingdom
- 5.5.2.2 Germany
- 5.5.2.3 France
- 5.5.2.4 Rest of Europe
- 5.5.3 Asia-Pacific
- 5.5.3.1 China
- 5.5.3.2 India
- 5.5.3.3 Japan
- 5.5.3.4 South-East Asia
- 5.5.3.5 Rest of Asia-Pacific
- 5.5.4 South America
- 5.5.4.1 Brazil
- 5.5.4.2 Argentina
- 5.5.4.3 Rest of South America
- 5.5.5 Middle East and Africa
- 5.5.5.1 Middle East
- 5.5.5.1.1 GCC
- 5.5.5.1.2 Turkey
- 5.5.5.1.3 Israel
- 5.5.5.1.4 Rest of Middle East
- 5.5.5.2 Africa
- 5.5.5.2.1 South Africa
- 5.5.5.2.2 Nigeria
- 5.5.5.2.3 Kenya
- 5.5.5.2.4 Rest of Africa
- 5.5.5.1 Middle East
- 5.5.1 North America
6 COMPETITIVE LANDSCAPE
- 6.1 Market Concentration
- 6.2 Strategic Moves
- 6.3 Market Share Analysis
- 6.4 Company Profiles (includes Global level Overview, Market level overview, Core Segments, Financials as available, Strategic Information, Market Rank/Share, Products and Services, Recent Developments)
- 6.4.1 Apttus Corporation
- 6.4.2 Oracle Corporation (NetSuite)
- 6.4.3 SAP SE
- 6.4.4 Salesforce.com Inc.
- 6.4.5 Amazon Web Services
- 6.4.6 Recurly Inc.
- 6.4.7 Stripe Inc.
- 6.4.8 Paddle.com Market Ltd.
- 6.4.9 Chargify LLC (Scaleworks)
- 6.4.10 Vindicia Inc.
- 6.4.11 BillingPlatform.com
- 6.4.12 Gotransverse LLC
- 6.4.13 Zuora Inc.
- 6.4.14 2Checkout / Verifone
- 6.4.15 Chargebee Inc.
- 6.4.16 Zoho Corporation Pvt. Ltd.
- 6.4.17 FastSpring
- 6.4.18 PayPal Holdings Inc.
- 6.4.19 CloudBlue (Ingram Micro)
- 6.4.20 Payrix (Worldpay/FIS)
7 MARKET OPPORTUNITIES AND FUTURE OUTLOOK
- 7.1 White-space and Unmet-Need Assessment


