

|
시장보고서
상품코드
2125491
해양 유전 서비스 시장 : 시장 점유율 분석, 업계 동향 및 통계, 성장 예측(2026-2031년)Offshore Oilfield Services - Market Share Analysis, Industry Trends & Statistics, Growth Forecasts (2026 - 2031) |
||||||
 Mordor Intelligence
Mordor Intelligence에 의하면, 2026년 해양 유전 서비스 시장 규모는 454억 6,000만 달러로 추정되고, 2025년 425억 7,000만 달러에서 확대해, 2031년에는 631억 3,000만 달러에 이를 것으로 예측됩니다.
2026-2031년 연평균 성장률(CAGR)은 6.78%를 나타낼 전망입니다.
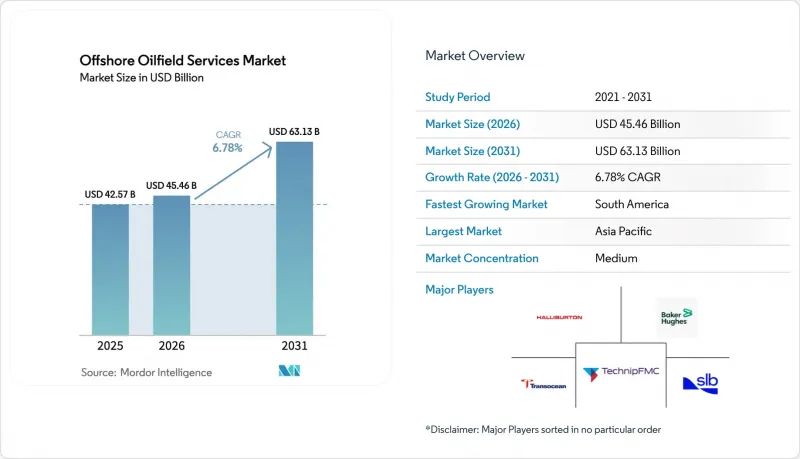
본 보고서는 서비스 유형별(시추 서비스, 마무리 서비스, 생산·개입 서비스, 기타 서비스), 수심별(얕은 바다, 심해, 초심해), 지역별(북미, 유럽, 아시아태평양, 남미, 중동 및 아프리카)로 분류되어 있습니다. 시장 규모와 전망은 금액(달러)으로 표시되어 있습니다.
세계의 해양 유전 서비스 시장 동향 및 인사이트
심해·초심해 시추 계약 증가 추세
SLB의 멕시코 8억 달러 규모 ‘트리온(Trion)’ 계약과 BP의 ‘카스키다(Kaskida)’ 개발 프로젝트 등이 다시 실행 단계에 접어들면서, 드릴십 가동률은 2025년에 97%에 달할 전망이며, 2020년의 저조한 수준에서 급격한 회복세를 보이고 있습니다. 나미비아에서 최근 수십억 배럴 규모의 매장량이 발견됨에 따라 심해 개발 파이프라인에 새로운 광구가 추가되었습니다. 계약업체들은 과거에는 경제성이 없었던 자원을 개발하기 위해 듀얼 BOP(방출 방지 장치)를 탑재한 드릴십, 동적 위치 유지 기술, 해저 처리 기술을 활용하고 있습니다. 장기적인 수요에 자신감을 가진 사업자들은 생산량 확대를 대가로 리드타임 연장을 수용하며, 디지털 트윈을 도입해 유정 비용의 예측 가능성을 확보하고 있습니다. 따라서 수심 5,000피트를 초과하는 초심해 저류층이 향후 생산 확대를 위한 핵심 광구로 부상하고 있습니다.
최신형 잭업 리그와 7세대 드릴십의 수급 긴축
7세대 드릴십은 현재 하루 50만 달러에 가까운 일당으로 운영되며, 수년에 걸친 계약을 확보하고 있습니다. 그 대표적인 예로, 노블 코퍼레이션의 다이아몬드 오프쇼어 인수에 따른 선단 확대와 75억 달러 규모의 수주 잔고를 들 수 있습니다. 얕은 해역 수요가 견조하게 유지되고 있는 동남아시아와 중동에서는 2025년 잭업식 리그의 가동률이 86%를 나타낼 것으로 예측됩니다. 2015년 이후 신규 건조 건수의 부진과 구형 리그의 해체 가속화가 맞물려 수급 긴박을 뒷받침하고 있습니다. 이에 따라 사업자들은 더 조기에, 그리고 장기간에 걸쳐 리그를 확보하는 한편, 도급업체들은 프리미엄 가격을 확보하기 위해 가동 재개를 서둘러 추진하고, 듀얼 액티비티 대응을 위한 업그레이드에 투자하고 있습니다.
선단의 과잉 공급을 배경으로 한 세미서브의 데이라이트 단축
5세대 및 6세대 반잠수식 시추선의 경우, 심해 부문 고객들이 범용성이 높은 드릴십으로 전환하고 있어 수요 증가세가 주춤하고 있습니다. 멕시코만의 여러 유닛이 2025년에 계약 만료를 맞이하지만, 적절한 후속 작업이 확보되지 않아 이 지역의 가동률은 선단 평균보다 낮습니다. 반잠수식 리그의 운영 비용은 동등한 수심의 드릴십보다 여전히 높기 때문에 특정 가혹한 환경이라는 틈새 시장을 제외하고는 경쟁이 제한적입니다. 각 계약업체들은 공급을 안정화하기 위해 업그레이드를 미루고, 경우에 따라 노후화된 유닛을 재사용하고 있습니다. 이러한 불균형은 수익성을 압박하고, 신기술 투자를 저해하는 요인이 되고 있습니다.
부문별 분석
시추 서비스는 유전 개발에 필수적인 자본 집약형 시추 리그에 힘입어 2025년에도 매출 점유율 40.12%를 차지했으며, 해양 유전 서비스 시장을 계속 주도했습니다. 시추와 관련된 해양 유전 서비스 시장 규모는 수년에 걸쳐 고사양 자산을 필요로 하는 장기 주기의 심해 프로젝트에 의해 주도되고 있습니다. 높은 일당은 계약업체의 이익률을 향상시켜, 이중 활동 및 자동화 업그레이드에 대한 재투자를 가능하게 합니다. 설계가 복잡해짐에 따라 마무리 및 개조 작업의 범위는 확대되고 있는 반면, 풍부한 데이터를 제공하는 로깅은 회수율을 향상시키는 자극 프로그램의 지침이 되고 있습니다.
생산 및 개입 서비스는 사업자가 코일드 튜빙, 와이어라인, 수압 개입 패키지를 활용하여 기존 유정의 생산량을 극대화함에 따라 2031년까지 연평균 성장률(CAGR) 7.25%로 성장할 전망입니다. 이러한 전환은 자본 규율과 부합하며, 신규 유전 개발에 비해 투자 회수 기간이 짧다는 장점이 있습니다. 지진 탐사, 항공, 해양 지원선, 해체 조치 등의 부대 서비스는 해양 유전 서비스 시장에 회복력을 부여하며, 계약업체의 사업 포트폴리오를 확대시키고 있습니다. 시드릴(Seadrill)과 트랜스오션(Transocean) 간의 합병 협상은 이 부문의 통합 추세를 상징하며, 운영상의 시너지 효과와 시추 서비스 및 생산 서비스 전반에 걸친 균형 잡힌 사업 전개를 목표로 하고 있습니다.
지역별 분석
아시아태평양은 2025년 매출의 47.15%를 차지했으며, 중국의 공급 안정화 노력, 동남아시아의 성숙한 기존 유전, 호주에서 부상하고 있는 600억 달러 규모의 해체 기회를 기반으로 주도적인 위치를 확립하고 있습니다. 중국해양석유(CNOOC)는 2025년에 하루 200만 BOE를 초과하는 생산을 계획하고 있으며, 그 배경에는 ‘Bozhong 26-6’, ‘Kenli 10-2’,‘Yellowtail’에 중점을 둔 1,250억-1,350억 위안(174억-188억 달러) 규모의 설비 투자가 있습니다. ‘멍샹’ 등 중국의 신형 시추선은 국내 역량을 강화하고 해외산 시추선에 대한 의존도를 낮추는 한편, 장기 용선 계약을 통해 LNG 확장 프로젝트용 시추 역량을 확보하고 있습니다.
남미는 성장세가 가장 두드러진 지역으로, 연평균 성장률(CAGR) 7.62%를 나타낼 것으로 예측됩니다. 페트로브라스는 2025-2029년 1,110억 달러를 예산으로 편성했으며, 부지오스 7과 멜로 단계에서는 대규모 해저 설비, FPSO, 유정 건설 서비스가 필요할 것입니다. 가이아나에서는 2025년까지 일일 80만 배럴의 생산량에 도달할 것으로 예상되며, 해저 트리, 지원선, 탑사이드 개조에 대한 큰 수요가 발생할 전망입니다. 수리남과 트리니다드는 탐사 측면에서 상향 조정 여지를 제공하며, 지역 프로젝트 기회를 지속적으로 창출하는 다수의 시추 장비를 통한 탐사 활동을 뒷받침하고 있습니다.
북미의 멕시코만에는 여전히 고생산성 자산으로 구성된 심해 핵심 지역이 존재하며, 꾸준한 평가정 시추와 기존 유전의 재개발을 통해 해양 유전 서비스 시장에 혜택을 주고 있습니다. 유럽에서는 북해의 생산 감소가 플러그 앤 어밴던먼트(Plug and Abandonment)에 대한 전문 지식이 필요한 증가하는 폐쇄 조치의 미처리 물량으로 상쇄되고 있습니다. 중동 및 아프리카에서는 다양한 성장이 나타나고 있습니다. 카타르, 아랍에미리트, 사우디아라비아는 가스 생산 능력에 대한 투자를 진행하는 한편, 나미비아, 앙골라, 나이지리아는 프론티어 플레이 탐사 예산 확보에 주력하고 있습니다.
기타 혜택
- 엑셀 형식 시장 전망(ME) 시트
- 3개월간의 애널리스트 지원
자주 묻는 질문
목차
제1장 서론
제2장 조사 방법
제3장 주요 요약
제4장 시장 구도
제5장 시장 규모 및 성장 예측
제6장 경쟁 구도
제7장 시장 기회 및 향후 전망
AJY 26.09.15According to Mordor Intelligence, offshore oilfield services market size in 2026 is estimated at USD 45.46 billion, growing from 2025 value of USD 42.57 billion with 2031 projections showing USD 63.13 billion, growing at 6.78% CAGR over 2026-2031.
This report is Segmented by Service Type (Drilling Services, Completion Services, Production and Intervention Services, and Other Services), Water Depth (Shallow Water, Deepwater, and Ultra-Deepwater), and Geography (North America, Europe, Asia-Pacific, South America, and Middle East and Africa). The Market Sizes and Forecasts are Provided in Terms of Value (USD).
Global Offshore Oilfield Services Market Trends and Insights
Up-cycle in Deep- & Ultra-Deepwater Drilling Commitments
Drillship utilisation is on track to hit 97% in 2025, a sharp reversal from the lows of 2020, as projects such as SLB's USD 800 million Trion contract in Mexico and BP's Kaskida development re-enter execution phases. Namibia's recent multi-billion-barrel finds add fresh acreage to the deepwater pipeline. Contractors lean on dual-BOP drillships, dynamic positioning, and subsea processing to unlock once uneconomic resources. Operators, confident in long-run demand, accept longer lead times in exchange for scalable barrels and inject digital twins to keep well costs predictable. Ultra-deepwater reservoirs above 5,000 ft therefore emerge as core acreage for future production growth.
Supply-Demand Crunch for Modern Jack-ups & 7G Drillships
Seventh-generation drillships now command day rates near USD 500,000 and secure multi-year deals, exemplified by Noble Corporation's fleet expansion and USD 7.5 billion backlog following its Diamond Offshore purchase. Jack-up utilisation is projected to be 86% in 2025 across Southeast Asia and the Middle East, where shallow-water demand remains resilient. Limited newbuild activity since 2015, combined with the accelerated scrapping of older rigs, underpins the tightness. Operators therefore lock in rigs earlier and for longer terms, while contractors fast-track reactivations and invest in dual-activity upgrades to capture premium pricing.
Semi-Sub Day-Rate Compression Amid Fleet Over-Capacity
Fifth- and sixth-generation semi-submersibles face muted demand as deepwater clients pivot to more versatile drillships. Several Gulf of Mexico units roll off contract in 2025 without timely follow-up work, pulling regional utilisation below fleet averages. Operating costs for semi-submersibles remain higher than those of drillships at comparable water depths, limiting their competitiveness outside specific harsh-environment niches. Contractors defer upgrades and, in some cases, recycle ageing units to stabilise supply. The imbalance weighs on profitability and acts as a drag on new technology investment.
Other drivers and restraints analyzed in the detailed report include:
- National Energy-Security Push in Asia & MENA
- Digital-First Integrated Service Contracts
- ESG-Driven Capital Rationing by Western Lenders
For complete list of drivers and restraints, kindly check the Table Of Contents.
Segment Analysis
Drilling services continued to lead the offshore oilfield services market with 40.12% revenue share in 2025, supported by capital-intensive rigs that remain indispensable for field development. The offshore oilfield services market size tied to drilling is driven by long-cycle deepwater projects that require high-specification assets for several years. High day-rates improve contractor margins and enable reinvestment in dual-activity and automation upgrades. Completion and workover scopes expand as designs become more complex, while data-rich logging guides stimulation programs that enhance recovery factors.
Production and intervention services are poised for a 7.25% CAGR through 2031 as operators maximise output from existing wells using coiled-tubing, wireline, and hydraulic intervention packages. This pivot aligns with capital discipline, offering shorter payback windows compared with new field developments. Ancillary services-such as seismic, aviation, offshore support vessels, and decommissioning-add resilience to the offshore oilfield services market, broadening contractor portfolios. Seadrill's merger talks with Transocean exemplify the sector's consolidation drive, aiming for operating synergies and balanced exposure across drilling and production services.
Complete Report Scope:
- By Service Type
- Drilling Services
- Completion Services (Cementing, Hydraulic Fracturing)
- Production and Intervention Services
- Other Services (OSV, seismic, decomm., aviation)
- By Water Depth
- Shallow Water (Below 400 ft)
- Deepwater (400 to 5,000 ft)
- Ultra-deepwater (Above 5,000 ft)
- By Geography
- North America
- United States
- Canada
- Mexico
- Europe
- Germany
- United Kingdom
- Norway
- Russia
- Rest of Europe
- Asia-Pacific
- China
- India
- Thailand
- Vietnam
- Australia
- Rest of Asia-Pacific
- South America
- Brazil
- Trinidad and Tobago
- Rest of South America
- Middle East and Africa
- Saudi Arabia
- United Arab Emirates
- Qatar
- Egypt
- Nigeria
- Angola
- Namibia
- Rest of Middle East and Africa
- North America
Geography Analysis
Asia-Pacific accounted for 47.15% of 2025 revenue, a leadership position anchored by China's drive for supply security, Southeast Asia's mature brownfields, and Australia's emerging USD 60 billion decommissioning opportunity. CNOOC plans to exceed 2 million BOE per day in 2025, backed by RMB 125-135 billion (USD 17.4-18.8 billion) capital expenditure focused on Bozhong 26-6, Kenli 10-2, and Yellowtail. New Chinese rigs, such as Meng Xiang, lift domestic capability and reduce reliance on foreign units, while long-term charters secure drilling capacity for LNG-expansion projects.
South America is the fastest-growing region, projected to grow at a 7.62% CAGR. Petrobras has earmarked USD 111 billion for the 2025-2029 period, with the Buzios 7 and Mero phases requiring extensive subsea, FPSO, and well-construction services. Guyana is expected to reach an output of 800,000 bpd by 2025, creating significant demand for subsea trees, support vessels, and topside modifications. Suriname and Trinidad add exploration upside, sustaining multi-rig campaigns that feed the regional project queue.
North America's Gulf of Mexico retains a deepwater core of high-productivity assets, benefiting the offshore oilfield services market through steady appraisal wells and brownfield redevelopments. Europe balances the decline in the North Sea with a growing decommissioning backlog that requires plug-and-abandonment expertise. The Middle East and Africa see diversified growth: Qatar, UAE, and Saudi Arabia invest in gas capacity, while Namibia, Angola, and Nigeria court exploration budgets for frontier plays.
- Schlumberger
- Halliburton
- Baker Hughes
- Weatherford
- Transocean
- Valaris
- Seadrill
- Noble Corp
- China Oilfield Services (COSL)
- TechnipFMC
- Subsea 7
- Saipem
- ADES Holding
- Shelf Drilling
- Nabors Industries
- Expro Group
- Oceaneering Intl.
- Petrofac
- Borr Drilling
- KCA Deutag
- Fluor E&C
Additional Benefits:
- The market estimate (ME) sheet in Excel format
- 3 months of analyst support
TABLE OF CONTENTS
1 Introduction
- 1.1 Study Assumptions & Market Definition
- 1.2 Scope of the Study
2 Research Methodology
3 Executive Summary
4 Market Landscape
- 4.1 Market Overview
- 4.2 Market Drivers
- 4.2.1 Up-cycle in deep- & ultra-deepwater drilling commitments
- 4.2.2 Supply-demand crunch for modern Jack-ups & 7G drillships
- 4.2.3 National energy-security push in Asia & MENA (long-term charters)
- 4.2.4 Digital-first integrated service contracts (real-time well-site ops)
- 4.2.5 Decommissioning wave in mature basins (UKCS, Australia)
- 4.2.6 Mandatory methane abatement credits for OSVs
- 4.3 Market Restraints
- 4.3.1 SEMI-sub day-rate compression amid fleet over-capacity
- 4.3.2 FX-driven cost inflation for crew & consumables
- 4.3.3 ESG-driven capital rationing by Western lenders
- 4.3.4 Chronic shortage of HPHT-graded BOP spare parts
- 4.4 Supply-Chain Analysis
- 4.5 Regulatory Landscape
- 4.6 Technological Outlook
- 4.7 Porter's Five Forces
- 4.7.1 Bargaining Power of Suppliers
- 4.7.2 Bargaining Power of Buyers
- 4.7.3 Threat of New Entrants
- 4.7.4 Threat of Substitutes
- 4.7.5 Competitive Rivalry
5 Market Size & Growth Forecasts
- 5.1 By Service Type
- 5.1.1 Drilling Services
- 5.1.2 Completion Services (Cementing, Hydraulic Fracturing)
- 5.1.3 Production and Intervention Services
- 5.1.4 Other Services (OSV, seismic, decomm., aviation)
- 5.2 By Water Depth
- 5.2.1 Shallow Water (Below 400 ft)
- 5.2.2 Deepwater (400 to 5,000 ft)
- 5.2.3 Ultra-deepwater (Above 5,000 ft)
- 5.3 By Geography
- 5.3.1 North America
- 5.3.1.1 United States
- 5.3.1.2 Canada
- 5.3.1.3 Mexico
- 5.3.2 Europe
- 5.3.2.1 Germany
- 5.3.2.2 United Kingdom
- 5.3.2.3 Norway
- 5.3.2.4 Russia
- 5.3.2.5 Rest of Europe
- 5.3.3 Asia-Pacific
- 5.3.3.1 China
- 5.3.3.2 India
- 5.3.3.3 Thailand
- 5.3.3.4 Vietnam
- 5.3.3.5 Australia
- 5.3.3.6 Rest of Asia-Pacific
- 5.3.4 South America
- 5.3.4.1 Brazil
- 5.3.4.2 Trinidad and Tobago
- 5.3.4.3 Rest of South America
- 5.3.5 Middle East and Africa
- 5.3.5.1 Saudi Arabia
- 5.3.5.2 United Arab Emirates
- 5.3.5.3 Qatar
- 5.3.5.4 Egypt
- 5.3.5.5 Nigeria
- 5.3.5.6 Angola
- 5.3.5.7 Namibia
- 5.3.5.8 Rest of Middle East and Africa
- 5.3.1 North America
6 Competitive Landscape
- 6.1 Market Concentration
- 6.2 Strategic Moves (M&A, Partnerships, PPAs)
- 6.3 Market Share Analysis (Market Rank/Share for key companies)
- 6.4 Company Profiles (includes Global level Overview, Market level overview, Core Segments, Financials as available, Strategic Information, Products & Services, and Recent Developments)
- 6.4.1 Schlumberger
- 6.4.2 Halliburton
- 6.4.3 Baker Hughes
- 6.4.4 Weatherford
- 6.4.5 Transocean
- 6.4.6 Valaris
- 6.4.7 Seadrill
- 6.4.8 Noble Corp
- 6.4.9 China Oilfield Services (COSL)
- 6.4.10 TechnipFMC
- 6.4.11 Subsea 7
- 6.4.12 Saipem
- 6.4.13 ADES Holding
- 6.4.14 Shelf Drilling
- 6.4.15 Nabors Industries
- 6.4.16 Expro Group
- 6.4.17 Oceaneering Intl.
- 6.4.18 Petrofac
- 6.4.19 Borr Drilling
- 6.4.20 KCA Deutag
- 6.4.21 Fluor E&C
7 Market Opportunities & Future Outlook
- 7.1 White-Space & Unmet-Need Assessment


