

|
시장보고서
상품코드
2154741
수소 가스 발생기 : 시장 점유율 분석, 업계 동향과 통계, 성장 예측(2026-2031년)Hydrogen Gas Generator - Market Share Analysis, Industry Trends & Statistics, Growth Forecasts (2026 - 2031) |
||||||
 Mordor Intelligence
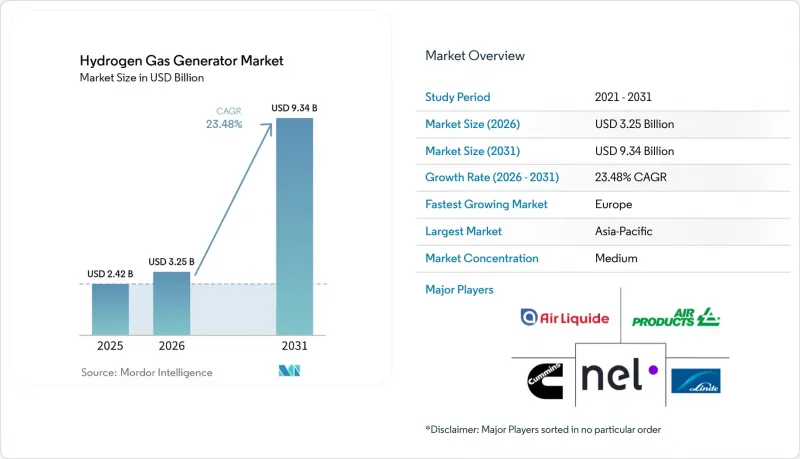
에 따르면 수소 가스 발생기 시장 규모는 2025년 24억 2,000만 달러, 2026년 32억 5,000만 달러에서 2031년까지 93억 4,000만 달러로 확대될 것으로 예측되며, 2026년부터 2031년까지 연평균 성장률(CAGR)은 23.48%가 될 전망입니다.
전 세계 수소 가스 발생기 시장의 동향 및 인사이트
산업 부문의 탈탄소화 및 저탄소 수소 조달
산업 분야의 구매자들은 수소 조달 결정에 있어 가격이나 수량뿐만 아니라 탄소 집약도에 관한 요건을 점점 더 중요하게 여기고 있습니다. 이에 따라 조달 규정이 구속력을 갖는 시장에서 수소 가스 발생기 시장에 대한 수요 신호가 더욱 명확해지고 있습니다. 환경 지속가능성 요건에 관한 EU 규정은 2026년 6월 30일 이후 시작되는 관련 공공 조달 절차에 적용되며, 대상인 넷제로 기술에 전해조가 포함되어 있습니다. 이에 따라 유럽 수소 가스 발생기 시장에서 저탄소 장비의 잠재적 시장 기회가 변화하게 될 것입니다. 중국의 ‘제15차 5개년 에너지 계획’에서는 2030년까지 재생 가능 수소의 연간 생산량을 200만 톤으로 하는 목표가 설정되었으며, 암모니아, 메탄올, 철강 사용자를 대상으로 한 2026년 시범 프로그램이 도입되었습니다. 이러한 프로그램을 통해 대형 알칼리형 및 PEM 시스템의 조달 기간이 단축될 가능성이 있습니다. 따라서 생산능력과 확실한 납기 일정을 갖춘 공급업체는 초기 계획 단계에서 설비 발주 단계로 전환되고 있는 프로젝트에 대응하는 데 있어 더 유리한 입장에 있습니다.
정유, 화학, 전자 분야의 현장 공급
정유소, 화학 플랜트, 반도체 시설에서는 외부 가스 공급 위험을 줄이기 위해 현장 발전을 활용하고 있습니다. 플러그 파워(Plug Power)는 2026년 1월, 갈프(Gulp)사의 시네스(Cines) 정유소에서 100MW 규모의 PEM 전해조 설치를 완료했습니다. 이를 통해 연간 1만 5,000톤의 재생 가능 수소 생산과 연간 11만 톤의 CO2e 배출 감축이 예상됩니다. 정유소에서의 용도에는 대량의 출력이 요구되는 반면, 반도체 분야의 용도에는 엄격하게 관리된 순도와 높은 신뢰성을 갖춘 가동 시간이 요구됩니다. 이러한 차이가 수소 가스 발생기 시장의 모든 용량 대역에 걸친 수요를 뒷받침하고 있습니다. 대규모 공정 시설에서는 기존 운영에 통합 가능하며, 장기간에 걸쳐 지원을 받을 수 있는 시스템이 선호됩니다. 반면, 소규모 전자기기 제조 시설이나 연구소에서는 정화 및 모니터링 기능이 통합되어 신속한 대응이 가능한 서비스 체제가 중요시됩니다.
높은 설비 투자 비용과 그린 수소의 비용 프리미엄
재생 가능 수소의 비용 프리미엄은 수소 가스 발생기 시장의 보급 확대를 가로막는 주요 장벽으로 남아 있습니다. ACER 보고서에 따르면, 2024년 기준 유럽에서 재생 가능 수소의 비용은 기존 수소의 4배에 달합니다. 재생 가능 자원, 탄소 가격 책정, 그리고 수입 가스 비용이 사업성을 뒷받침하는 지역에서는 이러한 격차가 줄어들 것으로 예상됩니다. 반면, 국내 가스 가격이 저렴하고 블루 수소가 명확한 비용 우위를 차지하는 지역에서는 격차가 계속해서 확대될 가능성이 높습니다. 보조금, 확정 구매 계약 또는 탄소 가격 책정이 없는 프로젝트는 더 엄격한 자금 조달 조건에 직면하게 됩니다. 또한, 금융 기관은 전해조의 장기적인 성능에 대해 확신을 가져야 하므로, 프로젝트 파이낸싱에서는 보증이나 가동 실적이 중요해집니다.
부문별 분석
2025년, 수소 발생 장치 시장에서 그레이 수소의 점유율은 71.8%를 차지했습니다. 이는 정유소, 암모니아, 메탄올 시설에서 수증기 메탄 개질법이 여전히 널리 사용되고 있기 때문입니다. 해당 공정의 도입 실적과 현재의 낮은 비용이 계속해서 구매 결정에 영향을 미치고 있습니다. 블랙 수소 및 브라운 수소는 석탄이나 갈탄의 가스화에 의존하는 지역에 여전히 집중되어 있습니다. 블루 수소는 천연가스 공급과 탄소 격리 옵션이 산업 프로젝트를 뒷받침하고 있는 북미 및 중동 지역에서 단기적으로는 중요한 역할을 유지하고 있습니다. 그린 수소는 조달 계약이 대형 전해조 수주를 뒷받침하고 있기 때문에 2031년까지 연평균 성장률(CAGR) 33.6%로 가장 빠른 성장을 기록할 것으로 예측됩니다.
유럽 수소 은행(European Hydrogen Bank)의 제3차 입찰에서는 2026년 2월, 유럽 경제 지역(EEA) 7개국에 위치한 9개 프로젝트에 10억 유로(10억 9,000만 달러 상당) 이상이 지원되었습니다. 선정된 프로젝트는 1.1GW의 전해조 용량을 갖추고 있으며, 첫 10년 동안 130만 톤 이상의 수소를 생산할 전망입니다. 인도의 ‘국가 그린 수소 미션’은 2030년까지 연간 최소 500만 메트르톤의 그린 수소 생산능력을 목표로 하고 있습니다. 2030년까지 산업 분야 내 재생 가능 수소 이용률을 42%로 끌어올리겠다는 EU의 목표는 개발자들에게 설비 도입에 대한 판단 기준을 더욱 명확하게 해주고 있습니다. 이러한 노력은 수소 발생 장치 시장에서 저배출형 생산 방식으로의 전환을 촉진하고 있습니다.
지역별 분석
아시아태평양은 중국의 거대한 전해조 제조 거점과 일본 및 한국의 수소 관련 프로그램의 뒷받침을 받아, 2025년 수소 가스 발생기 시장 점유율의 47.1%를 차지했습니다. 중국의 2026년 에너지 계획에서는 2030년까지 연간 200만 톤의 재생 가능 수소 생산을 목표로 하고 있으며, 그 활용 범위를 연료전지차에서 산업용 고객으로 확대하고 있습니다. 일본의 수요에는 수소 및 암모니아 혼소 외에도 현장 생산 모델도 포함됩니다. 인도는 ‘국가 그린 수소 미션’ 및 대규모 그린 암모니아 프로젝트 계획을 통해 지역 내 수요를 끌어올리고 있습니다. 한국 내 연료전지차의 보급은 스테이션형 발전에 대한 수요를 뒷받침하고 있습니다.
유럽은 2031년까지 연평균 성장률(CAGR) 26.8%로 성장할 것으로 예측되며, 이는 수소 발생 장치 시장에서 지역별 가장 높은 성장률입니다. 유럽 수소 은행(European Hydrogen Bank)의 경매에서는 총 전해조 용량이 1.1 GW에 달하는 9개 프로젝트에 10억 유로 이상(10억 9,000만 달러 상당)이 투자되었습니다. 함부르크의 그린 수소 허브는 연간 1만 톤의 그린 수소를 생산하는 100 MW 전해조를 공급할 사업자로 지멘스 에너지를 선정했습니다. 스페인의 Moeve 프로젝트는 해당 지역의 파이프라인에 300 MW 공급 계약을 추가했습니다. RED III 및 넷제로 산업법에 따른 규제 요건으로 인해 유럽 시장 전체의 수요 전망이 개선되고 있습니다.
북미에서의 활동은 연방 정부의 청정 수소 비용 목표와 멕시코만 연안 정유소용 수요, 지역 허브에 대한 투자에 힘입어 추진되고 있습니다. 칠레에서는 아타카마 사막에 풍부한 재생에너지 자원이 있어 수출 지향적인 프로젝트가 진행되고 있습니다. 브라질과 아르헨티나는 국가 탈탄소화 프로그램에 따라 생산능력 확대를 추진하고 있습니다. 사우디아라비아, 아랍에미리트(UAE), 이집트, 모로코, 남아프리카공화국은 수출 프로젝트를 추진하고 있으나, 인프라 구축 및 판매 계약의 진척 상황은 당초 발표에 비해 뒤처지고 있습니다.
기타 혜택:
- 엑셀 형식의 시장 예측(ME) 시트
- 3개월간의 애널리스트 지원
자주 묻는 질문
목차
제1장 소개
- 조사 가정과 시장 정의
- 조사 범위
제2장 조사 방법
제3장 주요 요약
제4장 시장 구도
- 시장 개요
- 시장 성장 촉진요인
- 시장 성장 억제요인
- 공급망 분석
- Porter's Five Forces 분석
- 기술 동향
- 규제 상황
- 투자 분석
제5장 시장 규모와 성장 예측
- 수소 종류별
- 유형별
- 용량별
- 지역별
- 북미
- 미국
- 캐나다
- 멕시코
- 유럽
- 독일
- 프랑스
- 이탈리아
- 스페인
- 영국
- 폴란드
- 러시아
- 기타 유럽 국가
- 아시아태평양
- 중국
- 인도
- 일본
- 한국
- 호주
- 인도네시아
- 베트남
- 태국
- 기타 아시아태평양 국가
- 남미
- 브라질
- 아르헨티나
- 칠레
- 기타 남미 국가
- 중동 및 아프리카
- 사우디아라비아
- 아랍에미리트
- 이집트
- 남아프리카공화국
- 모로코
- 기타 중동 및 아프리카 국가
- 북미
제6장 경쟁 구도
- 시장 집중도
- 전략적 동향
- 시장 점유율 분석
- 기업 개요
- Air Products and Chemicals, Inc.
- Asahi Kasei Corporation
- Cummins Inc.
- Enapter AG
- EPOCH Energy Technology Corp.
- HyGear B.V.
- Idroenergy S.r.l.
- ITM Power plc
- John Cockerill S.A.
- L'Air Liquide S.A.
- Linde plc
- McPhy Energy S.A.
- MVS Engineering Pvt. Ltd.
- Nel ASA
- Peak Scientific Instruments Ltd.
- Plug Power Inc.
- Siemens Energy AG
- Teledyne Energy Systems, Inc.
- thyssenkrupp nucera AG & Co. KGaA
- Toshiba Corporation
제7장 시장 기회와 향후 전망
KSM 26.10.29According to Mordor Intelligence, the hydrogen gas generator market size is projected to expand from USD 2.42 billion in 2025 and USD 3.25 billion in 2026 to USD 9.34 billion by 2031, registering a CAGR of 23.48% between 2026 and 2031.
Global Hydrogen Gas Generator Market Trends and Insights
Industrial Decarbonization and Low-Carbon Hydrogen Procurement
Industrial buyers are increasingly including carbon-intensity requirements in hydrogen supply decisions, not only price and volume. This gives the Hydrogen gas generator market a clearer demand signal where procurement rules are binding. The EU regulation on environmental sustainability requirements applies to relevant public procurement procedures launched from June 30, 2026, and includes electrolyzers among covered net-zero technologies. This changes the addressable opportunity for lower-carbon equipment in the European Hydrogen gas generator market. China's 15th Five-Year Energy Plan set a target of 2 million tonnes of annual renewable hydrogen production by 2030 and introduced a 2026 pilot program for ammonia, methanol, and steel users. These programs can shorten procurement timelines for large alkaline and PEM systems. Suppliers with manufacturing capacity and firm delivery schedules are therefore better placed to serve projects that are moving from early planning to equipment orders.
Onsite Supply for Refining, Chemicals, and Electronics
Refineries, chemical plants, and semiconductor facilities use onsite generation to reduce exposure to delivered-gas supply risks. Plug Power completed installation of 100 MW of PEM electrolyzers at Galp's Sines Refinery in January 2026, with expected output of 15,000 tonnes of renewable hydrogen per year and annual emissions reductions of 110,000 tonnes of CO2e. Refining applications require substantial output, while semiconductor applications require closely controlled purity and dependable uptime. This difference supports demand across the capacity range in the Hydrogen gas generator market. Large process sites favor systems that can be embedded in existing operations and supported over many years. Smaller electronics and laboratory sites favor integrated purification, monitoring, and responsive service arrangements.
High Capital Cost and Green-Hydrogen Cost Premium
The cost premium for renewable hydrogen remains the main barrier to broader adoption in the Hydrogen gas generator market. ACER reported that renewable hydrogen in Europe costs 4 times more than conventional hydrogen in 2024. The gap is expected to narrow where renewable resources, carbon pricing, and imported gas costs support the business case. It is likely to remain wider where domestic gas is inexpensive and blue hydrogen has a clear cost advantage. Projects without subsidies, firm offtake contracts, or carbon pricing face more difficult financing conditions. Lenders also need confidence in long-term electrolyzer performance, which makes warranties and operating evidence important to project financing.
Other drivers and restraints analyzed in the detailed report include:
- Electrolyzer Cost and Efficiency Improvements
- Hydrogen Mobility and Refueling Infrastructure
- Hydrogen Storage, Transport, and Safety Complexity
For complete list of drivers and restraints, kindly check the Table Of Contents.
Segment Analysis
Gray hydrogen held 71.8% of the Hydrogen gas generator market share in 2025 because steam methane reforming remained established at refinery, ammonia, and methanol facilities. Its installed base and lower current cost continue to shape purchasing decisions. Black and brown hydrogen remain concentrated in locations that rely on coal and lignite gasification. Blue hydrogen retains a near-term role in North America and the Middle East, where gas supply and carbon storage options support industrial projects. Green hydrogen is forecast to record the fastest growth at a 33.6% CAGR through 2031 as procurement commitments support larger electrolyzer orders.
The European Hydrogen Bank's third auction awarded more than EUR 1 billion, equivalent to USD 1.09 billion, to 9 projects in 7 European Economic Area countries in February 2026. The selected projects represent 1.1 GW of electrolyzer capacity and more than 1.3 million tonnes of hydrogen in their first 10 years. India's National Green Hydrogen Mission is targeting at least 5 million metric tonnes of annual green hydrogen production capacity by 2030. The EU target for 42% renewable hydrogen use in industry by 2030 gives developers a clearer basis for equipment commitments. These commitments strengthen the transition toward lower-emissions production pathways in the Hydrogen gas generator market.
Complete Report Scope:
- By Hydrogen Type
- Green Hydrogen
- Gray Hydrogen
- Black/Brown Hydrogen
- Blue Hydrogen
- By Type
- Onsite
- Portable
- By Capacity
- Less than 5 Nm3/h
- 5-15 Nm3/h
- 15-100 Nm3/h
- 100-2,000 Nm3/h
- Greater than 2,000 Nm3/h
- By Geography
- North America
- United States
- Canada
- Mexico
- Europe
- Germany
- France
- Italy
- Spain
- United Kingdom
- Poland
- Russia
- Rest of Europe
- Asia-Pacific
- China
- India
- Japan
- South Korea
- Australia
- Indonesia
- Vietnam
- Thailand
- Rest of Asia-Pacific
- South America
- Brazil
- Argentina
- Chile
- Rest of South America
- Middle East and Africa
- Saudi Arabia
- United Arab Emirates
- Egypt
- South Africa
- Morocco
- Rest of Middle East and Africa
- North America
Geography Analysis
Asia-Pacific held 47.1% of the Hydrogen gas generator market share in 2025, supported by China's large electrolyzer manufacturing base and the hydrogen programs of Japan and South Korea. China's 2026 energy plan targets 2 million tonnes of annual renewable hydrogen production by 2030 and expands use beyond fuel cell vehicles to industrial customers. Japan's demand includes hydrogen and ammonia co-firing as well as onsite production models. India adds to regional demand through the National Green Hydrogen Mission and large green ammonia project planning. South Korea's fuel cell vehicle deployment supports demand for station-format generation.
Europe is forecast to grow at a 26.8% CAGR through 2031, the highest regional rate in the Hydrogen gas generator market. The European Hydrogen Bank auction committed more than EUR 1 billion, equivalent to USD 1.09 billion, to 9 projects that total 1.1 GW of electrolyzer capacity. The Hamburg Green Hydrogen Hub selected Siemens Energy to supply a 100 MW electrolyzer for an annual output of 10,000 tonnes of green hydrogen. Spain's Moeve project adds a 300 MW supply agreement to the regional pipeline. Regulatory requirements under RED III and the Net-Zero Industry Act improve demand visibility across European markets.
North American activity is supported by federal clean-hydrogen cost goals and investment in Gulf Coast refinery applications and regional hubs. Chile has advanced export-oriented projects because the Atacama Desert has strong renewable resources. Brazil and Argentina are developing capacity under national decarbonization programs. Saudi Arabia, the UAE, Egypt, Morocco, and South Africa are developing export projects, although infrastructure and offtake agreements have progressed more slowly than early announcements.
- Air Products and Chemicals, Inc.
- Asahi Kasei Corporation
- Cummins Inc.
- Enapter AG
- EPOCH Energy Technology Corp.
- HyGear B.V.
- Idroenergy S.r.l.
- ITM Power plc
- John Cockerill S.A.
- L'Air Liquide S.A.
- Linde plc
- McPhy Energy S.A.
- MVS Engineering Pvt. Ltd.
- Nel ASA
- Peak Scientific Instruments Ltd.
- Plug Power Inc.
- Siemens Energy AG
- Teledyne Energy Systems, Inc.
- thyssenkrupp nucera AG & Co. KGaA
- Toshiba Corporation
Additional Benefits:
- The market estimate (ME) sheet in Excel format
- 3 months of analyst support
TABLE OF CONTENTS
1 INTRODUCTION
- 1.1 Study Assumptions and Market Definition
- 1.2 Scope of the Study
2 RESEARCH METHODOLOGY
3 EXECUTIVE SUMMARY
4 MARKET LANDSCAPE
- 4.1 Market Overview
- 4.2 Market Drivers
- 4.2.1 Industrial Decarbonization and Low-Carbon Hydrogen Procurement
- 4.2.2 Onsite Supply for Refining, Chemicals, and Electronics
- 4.2.3 Electrolyzer Cost and Efficiency Improvements
- 4.2.4 Hydrogen Mobility and Refueling Infrastructure
- 4.2.5 Distributed Hydrogen for Grid-Resilient Power
- 4.2.6 Hydrogen Purity Requirements in Semiconductor and Laboratory Applications
- 4.3 Market Restraints
- 4.3.1 High Capital Cost and Green-Hydrogen Cost Premium
- 4.3.2 Hydrogen Storage, Transport, and Safety Complexity
- 4.3.3 Stack Degradation, Water Quality, and Balance-of-Plant Maintenance
- 4.3.4 Interconnection Delays and Intermittent Renewable Power Availability
- 4.4 Supply-Chain Analysis
- 4.5 Porter's Five Forces Analysis
- 4.5.1 Bargaining Power of Suppliers
- 4.5.2 Bargaining Power of Buyers
- 4.5.3 Threat of New Entrants
- 4.5.4 Threat of Substitutes
- 4.5.5 Competitive Rivalry
- 4.6 Technology Outlook
- 4.7 Regulatory Landscape
- 4.8 Investment Analysis
5 MARKET SIZE AND GROWTH FORECASTS
- 5.1 By Hydrogen Type
- 5.1.1 Green Hydrogen
- 5.1.2 Gray Hydrogen
- 5.1.3 Black/Brown Hydrogen
- 5.1.4 Blue Hydrogen
- 5.2 By Type
- 5.2.1 Onsite
- 5.2.2 Portable
- 5.3 By Capacity
- 5.3.1 Less than 5 Nm3/h
- 5.3.2 5-15 Nm3/h
- 5.3.3 15-100 Nm3/h
- 5.3.4 100-2,000 Nm3/h
- 5.3.5 Greater than 2,000 Nm3/h
- 5.4 By Geography
- 5.4.1 North America
- 5.4.1.1 United States
- 5.4.1.2 Canada
- 5.4.1.3 Mexico
- 5.4.2 Europe
- 5.4.2.1 Germany
- 5.4.2.2 France
- 5.4.2.3 Italy
- 5.4.2.4 Spain
- 5.4.2.5 United Kingdom
- 5.4.2.6 Poland
- 5.4.2.7 Russia
- 5.4.2.8 Rest of Europe
- 5.4.3 Asia-Pacific
- 5.4.3.1 China
- 5.4.3.2 India
- 5.4.3.3 Japan
- 5.4.3.4 South Korea
- 5.4.3.5 Australia
- 5.4.3.6 Indonesia
- 5.4.3.7 Vietnam
- 5.4.3.8 Thailand
- 5.4.3.9 Rest of Asia-Pacific
- 5.4.4 South America
- 5.4.4.1 Brazil
- 5.4.4.2 Argentina
- 5.4.4.3 Chile
- 5.4.4.4 Rest of South America
- 5.4.5 Middle East and Africa
- 5.4.5.1 Saudi Arabia
- 5.4.5.2 United Arab Emirates
- 5.4.5.3 Egypt
- 5.4.5.4 South Africa
- 5.4.5.5 Morocco
- 5.4.5.6 Rest of Middle East and Africa
- 5.4.1 North America
6 COMPETITIVE LANDSCAPE
- 6.1 Market Concentration
- 6.2 Strategic Moves
- 6.3 Market Share Analysis
- 6.4 Company Profiles (includes Global Level Overview, Market Level Overview, Core Segments, Financials as available, Strategic Information, Products and Services, Recent Developments)
- 6.4.1 Air Products and Chemicals, Inc.
- 6.4.2 Asahi Kasei Corporation
- 6.4.3 Cummins Inc.
- 6.4.4 Enapter AG
- 6.4.5 EPOCH Energy Technology Corp.
- 6.4.6 HyGear B.V.
- 6.4.7 Idroenergy S.r.l.
- 6.4.8 ITM Power plc
- 6.4.9 John Cockerill S.A.
- 6.4.10 L'Air Liquide S.A.
- 6.4.11 Linde plc
- 6.4.12 McPhy Energy S.A.
- 6.4.13 MVS Engineering Pvt. Ltd.
- 6.4.14 Nel ASA
- 6.4.15 Peak Scientific Instruments Ltd.
- 6.4.16 Plug Power Inc.
- 6.4.17 Siemens Energy AG
- 6.4.18 Teledyne Energy Systems, Inc.
- 6.4.19 thyssenkrupp nucera AG & Co. KGaA
- 6.4.20 Toshiba Corporation
7 MARKET OPPORTUNITIES AND FUTURE OUTLOOK
- 7.1 White-Space and Unmet-Need Assessment


