

|
시장보고서
상품코드
2155238
전력 : 시장 점유율 분석, 업계 동향과 통계, 성장 예측(2026-2031년)Electricity - Market Share Analysis, Industry Trends & Statistics, Growth Forecasts (2026 - 2031) |
||||||
 Mordor Intelligence
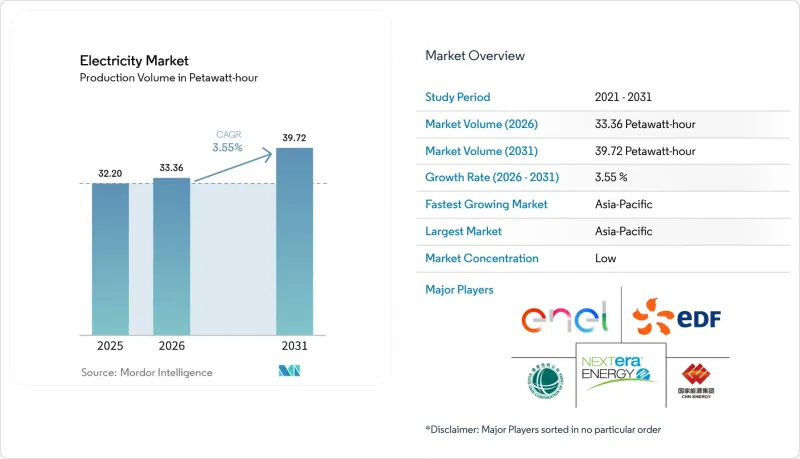
에 따르면 발전량 기반 전력 시장 규모는 2025년 32.20 페타와트시에서 2026년에는 33.36 페타와트시에 증가하며, 2031년까지 39.72 페타와트시에 달할 것으로 예상되고 있으며, 2026-2031년까지의 CAGR은 3.55%에 달할 전망입니다.
세계 전력 시장의 동향 및 인사이트
데이터센터 및 AI 부하의 확대
AI용 서버의 전력 소비량은 2025년 95테라와트시에서 2026년에는 175테라와트시로 증가할 것으로 예상되며, 이에 따라 데이터센터 수요가 세계 전력 시장의 단기적인 성장 동력이 될 전망입니다. IEA(국제에너지기구)는 기본 시나리오에서 전 세계 데이터센터의 총 전력 사용량이 2026년에 565테라와트시에 달하고, 2030년까지 945테라와트시에 근접할 것으로 예측하고 있습니다. 이러한 수요는 특정 지역에 집중되어 있으므로 신뢰성 높은 네트워크 접근성, 신속한 계통 연계, 그리고 청정 전력 확보가 신규 시설의 부지 선정에 영향을 미치고 있습니다. 북유럽, 텍사스주, 동남아시아는 신속한 계통 연계를 지원하는 허가·인가 제도와 재생에너지 전용 요금 제도의 혜택을 누릴 수 있습니다. 5대 주요 기술 기업은 2025년에 4,000억 달러 이상을 투자하고, 2026년에는 설비 투자를 더욱 확대할 것으로 예상되어, 이로 인해 신규 발전 용량 및 송전망 용량에 대한 압박이 커지고 있습니다. 이러한 투자는 전력 공급 사업자에게는 기회가 되는 한편, 지역 인프라가 프로젝트 진행 속도를 따라가지 못할 위험도 높이고 있습니다.
산업·제조업의 전기화
산업 부문의 전력 수요는 화석 연료 기반 열원을 전기 설비로 대체하고, 전력 집약적 제조업의 성장이 지원하고 있습니다. 유럽 산업 부문의 전기화율은 전력 구성에서 이미 72%가 탈탄소화되었음에도 불구하고 2024년에 1퍼센트 포인트 상승했습니다. 이는 송전망 용량과 프로젝트의 경제성이 여전히 중요한 장벽으로 작용하고 있음을 보여줍니다. 중국의 산업 부문은 2025년에 6,518 TWh를 소비했으며, 이는 제조 역량이 아시아로 계속 이동하고 있음을 반영합니다. 2022-2024년에 중국의 태양광 모듈, 배터리, 전기자동차 제조는 각각 연간 300 TWh 이상의 전력을 소비했습니다. 따라서 세계 전력 시장은 단순한 광범위한 경제 성장뿐만 아니라 소수의 고부하 산업 클러스터에 대한 의존도를 점점 더 높이고 있습니다. 산업의 전기화는 청정 전력 이용을 촉진하는 한편, 송전망 업그레이드가 완료되기 전에 공장이 연결됨으로써 국지적인 혼잡을 유발할 수도 있습니다.
계통 연계 대기 및 상호 연결의 병목 현상
송전망 연결 지연은 여전히 세계 전력 시장의 주요 제약 요인으로 남아 있습니다. 이는 네트워크 조사 및 업그레이드가 완료되기 전까지는 프로젝트가 전력 공급에 기여하거나 새로운 부하를 감당할 수 없기 때문입니다. 2025년 말 기준으로, 미국에서는 약 8,200건의 프로젝트에 걸쳐 2,061 GW의 발전 및 저장 용량이 계통 연계를 신청한 상태였습니다. 신청부터 상업 운전 개시까지의 대기 기간 중앙값은 5년을 초과했습니다. 단계적인 조사 절차, 비용 배분 규칙 및 계통 운영 사업자의 인력 제약이 이러한 대기 기간을 장기화시키고 있습니다. FERC(연방에너지규제위원회)의 개혁으로 2024년에는 체결된 계통 연계 계약이 33% 증가했으나, 기존 미처리 건수는 여전히 막대한 수에 달하고 있습니다. 다른 지역에서도 유사한 과제가 나타나고 있으며, 그곳에서는 프로젝트 일정이 인허가 취득 및 송전망 투자 속도에 좌우되고 있습니다.
부문 분석
2025년, 석탄은 세계 전력 시장 점유율의 32.6%를 차지하며 단일 발전원으로는 최대 규모를 기록했습니다. 2025년에는 석탄 발전량이 63 TWh 감소했는데, 이는 전 세계 전력 공급 구성에서 재생 가능 에너지의 발전량이 석탄을 앞지른 것이 1세기 이상 만에 처음 있는 일임을 나타내며, 석탄의 설비 용량과 실제 발전량에는 서로 다른 추세가 나타나고 있음을 보여줍니다. 2025년 신규 석탄 화력 발전소의 가동 개시 용량은 97.4GW에 달했으며, 그중 중국이 78.1 GW, 인도가 10 GW를 차지했습니다. 또한 수력 발전과 바이오에너지 역시 현지 자원이 이를 지원하는 국가들에서는 여전히 중요한 위치를 차지하고 있습니다.
재생 가능 에너지는 가장 빠르게 성장하고 있는 전력원이며, 2031년까지의 연평균 성장률(CAGR)은 8.2%로 예측됩니다. 재생에너지 발전 세계 시장 규모는 주로 태양광발전에 의해 지원되고 있으며, 2025년에는 636 TWh의 발전량이 추가되었습니다. IEA는 2030년까지 태양광발전에 의한 발전량이 연간 600 TWh 가까이 증가할 것으로 예측하고 있습니다. 풍력발전과 태양광발전은 발전량이 수요와 일치하는 지역에서는 화석 연료에 의한 발전을 줄여주지만, 시간대나 계절에 따른 변동을 관리하는 시스템이 필요합니다. 전 세계 전력 업계는 발전 용량을 확대하는 한편, 유연한 운영에 대한 필요성도 높아지고 있습니다.
지역별 분석
아시아태평양은 2025년 세계 전력 시장 규모의 51.9%를 차지하고 있으며, 2031년까지 연평균 성장률(CAGR) 4.5%로 성장할 것으로 예측되는데, 이는 지역별로는 가장 높은 성장률입니다. 중국, 인도, 동남아시아, 호주가 이 지역의 수요와 공급 확대에 주요 원동력이 되고 있습니다. 2025년 중국의 전력 소비량은 10.37 PWh를 넘어섰으며, 2026년 상반기에는 첨단 제조업과 인터넷 데이터 서비스가 강력한 성장세를 보였습니다. NTPC는 2025-26 회계연도에 9.6GW(이 중 재생 가능 에너지 발전 용량 5.5GW)를 증설하여, 2037 회계연도까지 250 GW를 목표로 하고 있습니다. 2025년 전 세계 신규 재생에너지 발전 용량의 증가분 중 아시아태평양이 74.2%를 차지했습니다.
북미와 유럽을 합치면 전 세계 전력 소비량의 3분의 1을 차지하며 비교적 완만한 속도로 증가했습니다. 미국의 전력 소비량은 2025년에 2.1% 증가했으며, 2030년까지 연평균 2%의 증가가 예상되는데, 국내 추가 수요의 절반은 데이터센터에서 비롯된 것입니다. 유럽의 전력 소비량은 2025년에 1% 미만의 증가에 그칠 것으로 보이며, 2021년 수준으로 회복되는 것은 2028년이 될 전망입니다. 유럽연합 집행위원회의 ‘전문화 행동 계획’은 2040년까지 2,000 TWh 이상으로 파악된 산업의 전문화 잠재력을 포함하여 중기적인 수요 증가를 지원하고 있습니다.
남미, 중동 및 아프리카는 세계 전력 시장에 있으며, 지역별로 편차는 있지만 실질적인 성장 기회를 제공하고 있습니다. 중동의 전력 수요는 냉방 수요, 인구 증가, 산업 확대로 인해 2025년에 4% 증가했습니다. 사우디아라비아에서는 자프라(Jafra)의 가스 공급 능력과 재생 가능 에너지 프로젝트가 가동을 시작함에 따라 2025년에 발전용 석유 소비량을 하루 10만 배럴 줄였습니다. 아프리카의 재생에너지 발전 용량은 2025년에 15.9% 증가했고, 중동의 발전 용량은 28.9% 증가했으나, 둘 다 낮은 수준에서 출발했습니다. 브라질의 수력발전을 주축으로 하는 전력 시스템은 여전히 계절적 변동의 영향을 받기 쉬우므로, 화력발전에 의한 백업의 필요성이 계속되고 있습니다.
기타 혜택:
- 엑셀 형식의 시장 예측(ME) 시트
- 3개월간의 애널리스트 지원
자주 묻는 질문
목차
제1장 서론
- 조사 전제조건과 시장 정의
- 조사 범위
제2장 조사 방법
제3장 개요
제4장 시장 구도
- 시장 개요
- 시장 성장 촉진요인
- 시장 성장 억제요인
- 공급망 분석
- 기술 동향
- 규제 상황
- Porter's Five Forces 분석
제5장 시장 규모와 성장 예측
- 발전원별
- 전력 소비자별
- 발전 방식별
- 지역별
- 북미
- 미국
- 캐나다
- 멕시코
- 유럽
- 독일
- 프랑스
- 이탈리아
- 스페인
- 영국
- 폴란드
- 러시아
- 기타 유럽 국가
- 아시아태평양
- 중국
- 인도
- 일본
- 한국
- 호주
- 인도네시아
- 베트남
- 태국
- 기타 아시아태평양 국가
- 남미
- 브라질
- 아르헨티나
- 칠레
- 기타 남미 국가
- 중동 및 아프리카
- 사우디아라비아
- 아랍에미리트
- 이집트
- 남아프리카공화국
- 모로코
- 기타 중동 및 아프리카 국가
- 북미
제6장 경쟁 구도
- 시장 집중도
- 전략적 동향
- 시장 점유율 분석
- 기업 개요
- State Grid Corporation of China
- China Southern Power Grid Co., Ltd.
- China Energy Investment Corporation Limited
- Electricite de France S.A.(EDF)
- NextEra Energy, Inc.
- Enel S.p.A.
- Iberdrola, S.A.
- E.ON SE
- ENGIE S.A.
- RWE AG
- Duke Energy Corporation
- The Southern Company
- Dominion Energy, Inc.
- Exelon Corporation
- National Grid plc
- NTPC Limited
- Korea Electric Power Corporation(KEPCO)
- China Yangtze Power Co., Ltd.
- Abu Dhabi National Energy Company PJSC(TAQA)
- Tokyo Electric Power Company Holdings, Inc.
제7장 시장 기회와 향후 전망
KSA 26.10.28According to Mordor Intelligence, the electricity market size in terms of production volume is expected to increase from 32.20 Petawatt-hour in 2025 to 33.36 Petawatt-hour in 2026 and reach 39.72 Petawatt-hour by 2031, at a CAGR of 3.55% over 2026-2031.
Global Electricity Market Trends and Insights
Data Center and AI Load Expansion
AI-oriented servers are expected to consume 175 TWh in 2026, compared with 95 TWh in 2025, which makes data center demand a near-term source of growth for the global electricity market The IEA expects total global data center electricity use to reach 565 TWh in 2026 and approach 945 TWh by 2030 in its base case. This demand is concentrated, so access to reliable networks, prompt interconnection, and clean power is influencing where new facilities are built. Northern Europe, Texas, and Southeast Asia can benefit from permitting and dedicated renewable tariffs that support faster connections. Five large technology companies spent more than USD 400 billion in 2025 and are expected to increase capital spending further in 2026, adding pressure for new generation and network capacity. These investments give electricity suppliers opportunities, but they also raise the risk that local infrastructure falls behind project pipelines.
Industrial and Manufacturing Electrification
Industrial electricity demand is supported by the replacement of fossil-fuel heat with electric equipment and the growth of electricity-intensive manufacturing. Europe's industrial electrification rose by 1 percentage point in 2024 despite a power mix that was already 72% decarbonized, showing that network capacity and project economics remain important barriers. China's industrial sector consumed 6,518 TWh in 2025, reflecting the continuing shift of manufacturing capacity toward Asia. Solar module, battery, and electric vehicle manufacturing in China used more than 300 TWh each year from 2022 to 2024. The global electricity market, therefore, depends increasingly on a smaller number of high-load industrial clusters rather than only on broad economic growth. Industrial electrification can strengthen the utilization of clean power, but it also creates localized congestion where factories connect faster than grid upgrades are completed.
Grid Connection Queues and Interconnection Bottlenecks
Grid connection delays remain a central restraint on the global electricity market because projects cannot contribute to supply or serve new load before network studies and upgrades are completed. At the end of 2025, 2,061 GW of generation and storage capacity were seeking interconnection in the United States across almost 8,200 projects. The median wait from application to commercial operation exceeded 5 years. Sequential study processes, cost allocation rules, and staffing limits at system operators have prolonged these queues. FERC reforms increased completed interconnection agreements by 33% in 2024, but the existing backlog remains significant. The same challenge is present in other regions, where project timelines depend on permitting and the pace of investment in transmission.
Other drivers and restraints analyzed in the detailed report include:
- Electric Vehicle and Transport Electrification
- Renewable and Nuclear Capacity Expansion
- Transmission Equipment and Critical Mineral Supply Exposure
For complete list of drivers and restraints, kindly check the Table Of Contents.
Segment Analysis
Coal held 32.6% of the global electricity market share in 2025, making it the largest individual generation source. Coal generation fell by 63 TWh in 2025 as renewable output exceeded coal in the global mix for the first time in more than a century, showing that installed coal capacity and delivered generation can follow different paths. New coal commissioning reached 97.4 GW in 2025, with China accounting for 78.1 GW and India for 10 GW. Hydropower and bioenergy also remain important in countries where local resources support them.
Renewable electricity is the fastest-growing source, with an 8.2% CAGR forecast through 2031. The global electricity market size for renewable generation is supported mainly by solar PV, which added 636 TWh of output in 2025. The IEA expects solar to add close to 600 TWh of generation annually through 2030. Wind and solar reduce fossil generation where their output matches demand, but they require systems that manage variation across hours and seasons. The global electricity industry is adding capacity while increasing its need for flexible operation.
Complete Report Scope:
- By Electricity Generation Source
- Oil
- Natural Gas
- Coal
- Nuclear energy
- Renewable
- Other Sources
- By Electricity Consumer
- Residential
- Commercial
- Industrial
- Transportation
- Agriculture
- Other Consumers
- By Generation Type
- Centralized Generation
- Distributed Generation
- By Geography
- North America
- United States
- Canada
- Mexico
- Europe
- Germany
- France
- Italy
- Spain
- United Kingdom
- Poland
- Russia
- Rest of Europe
- Asia-Pacific
- China
- India
- Japan
- South Korea
- Australia
- Indonesia
- Vietnam
- Thailand
- Rest of Asia-Pacific
- South America
- Brazil
- Argentina
- Chile
- Rest of South America
- Middle East and Africa
- Saudi Arabia
- United Arab Emirates
- Egypt
- South Africa
- Morocco
- Rest of Middle East and Africa
- North America
Geography Analysis
Asia-Pacific accounted for 51.9% of the global electricity market size in 2025 and is forecast to grow at a 4.5% CAGR through 2031, the highest regional rate. China, India, Southeast Asia, and Australia are the main sources of regional demand and supply expansion. China's electricity consumption exceeded 10.37 PWh in 2025, while high-technology manufacturing and internet data services showed strong growth in the first half of 2026. NTPC added 9.6 GW in fiscal year 2025-26, including 5.5 GW of renewable capacity, and is targeting 250 GW by fiscal year 2037. Asia-Pacific contributed 74.2% of new global renewable capacity additions in 2025.
North America and Europe together represented one-third of global electricity use and grew at more moderate rates. U.S. electricity consumption increased 2.1% in 2025 and is forecast to rise 2% annually through 2030, with data centers responsible for half of the additional national demand. European electricity consumption rose by less than 1% in 2025 and is not expected to return to its 2021 level until 2028. The European Commission's Electrification Action Plan supports a medium-term increase in demand, including industrial electrification potential identified at more than 2,000 TWh by 2040/
South America, the Middle East, and Africa offer uneven but material expansion opportunities for the global electricity market. Middle Eastern electricity demand rose 4% in 2025 because of cooling, population growth, and industrial expansion. Saudi Arabia reduced oil burn for power generation by 100,000 barrels per day in 2025 as gas capacity from Jafurah and renewable projects came online. Renewable capacity in Africa increased 15.9% in 2025 and capacity in the Middle East grew 28.9%, although both started from lower levels. Brazil's hydropower-led system remains exposed to seasonal variation, which sustains a need for thermal backup.
- State Grid Corporation of China
- China Southern Power Grid Co., Ltd.
- China Energy Investment Corporation Limited
- Electricite de France S.A. (EDF)
- NextEra Energy, Inc.
- Enel S.p.A.
- Iberdrola, S.A.
- E.ON SE
- ENGIE S.A.
- RWE AG
- Duke Energy Corporation
- The Southern Company
- Dominion Energy, Inc.
- Exelon Corporation
- National Grid plc
- NTPC Limited
- Korea Electric Power Corporation (KEPCO)
- China Yangtze Power Co., Ltd.
- Abu Dhabi National Energy Company PJSC (TAQA)
- Tokyo Electric Power Company Holdings, Inc.
Additional Benefits:
- The market estimate (ME) sheet in Excel format
- 3 months of analyst support
TABLE OF CONTENTS
1 INTRODUCTION
- 1.1 Study Assumptions and Market Definition
- 1.2 Scope of the Study
2 RESEARCH METHODOLOGY
3 EXECUTIVE SUMMARY
4 MARKET LANDSCAPE
- 4.1 Market Overview
- 4.2 Market Drivers
- 4.2.1 Data-Centre and AI Load Expansion
- 4.2.2 Industrial and Manufacturing Electrification
- 4.2.3 Cooling, Heat-Pump and Appliance Penetration
- 4.2.4 Electric-Vehicle and Transport Electrification
- 4.2.5 Renewable and Nuclear Capacity Expansion
- 4.2.6 Oil-to-Gas Switching in Middle Eastern Power Systems
- 4.3 Market Restraints
- 4.3.1 Grid-Connection Queues and Interconnection Bottlenecks
- 4.3.2 Transmission Equipment and Critical-Mineral Supply Exposure
- 4.3.3 Weather-Driven Variability and Flexibility Shortfalls
- 4.3.4 Electricity Affordability and Tariff Volatility
- 4.4 Supply-Chain Analysis
- 4.5 Technology Outlook
- 4.6 Regulatory Landscape
- 4.7 Porter's Five Forces Analysis
- 4.7.1 Bargaining Power of Suppliers
- 4.7.2 Bargaining Power of Buyers
- 4.7.3 Threat of New Entrants
- 4.7.4 Threat of Substitutes
- 4.7.5 Competitive Rivalry
5 MARKET SIZE AND GROWTH FORECASTS
- 5.1 By Electricity Generation Source
- 5.1.1 Oil
- 5.1.2 Natural Gas
- 5.1.3 Coal
- 5.1.4 Nuclear energy
- 5.1.5 Renewable
- 5.1.6 Other Sources
- 5.2 By Electricity Consumer
- 5.2.1 Residential
- 5.2.2 Commercial
- 5.2.3 Industrial
- 5.2.4 Transportation
- 5.2.5 Agriculture
- 5.2.6 Other Consumers
- 5.3 By Generation Type
- 5.3.1 Centralized Generation
- 5.3.2 Distributed Generation
- 5.4 By Geography
- 5.4.1 North America
- 5.4.1.1 United States
- 5.4.1.2 Canada
- 5.4.1.3 Mexico
- 5.4.2 Europe
- 5.4.2.1 Germany
- 5.4.2.2 France
- 5.4.2.3 Italy
- 5.4.2.4 Spain
- 5.4.2.5 United Kingdom
- 5.4.2.6 Poland
- 5.4.2.7 Russia
- 5.4.2.8 Rest of Europe
- 5.4.3 Asia-Pacific
- 5.4.3.1 China
- 5.4.3.2 India
- 5.4.3.3 Japan
- 5.4.3.4 South Korea
- 5.4.3.5 Australia
- 5.4.3.6 Indonesia
- 5.4.3.7 Vietnam
- 5.4.3.8 Thailand
- 5.4.3.9 Rest of Asia-Pacific
- 5.4.4 South America
- 5.4.4.1 Brazil
- 5.4.4.2 Argentina
- 5.4.4.3 Chile
- 5.4.4.4 Rest of South America
- 5.4.5 Middle East and Africa
- 5.4.5.1 Saudi Arabia
- 5.4.5.2 United Arab Emirates
- 5.4.5.3 Egypt
- 5.4.5.4 South Africa
- 5.4.5.5 Morocco
- 5.4.5.6 Rest of Middle East and Africa
- 5.4.1 North America
6 COMPETITIVE LANDSCAPE
- 6.1 Market Concentration
- 6.2 Strategic Moves
- 6.3 Market Share Analysis
- 6.4 Company Profiles (includes Global Level Overview, Market Level Overview, Core Segments, Financials as available, Strategic Information, Products and Services, Recent Developments)
- 6.4.1 State Grid Corporation of China
- 6.4.2 China Southern Power Grid Co., Ltd.
- 6.4.3 China Energy Investment Corporation Limited
- 6.4.4 Electricite de France S.A. (EDF)
- 6.4.5 NextEra Energy, Inc.
- 6.4.6 Enel S.p.A.
- 6.4.7 Iberdrola, S.A.
- 6.4.8 E.ON SE
- 6.4.9 ENGIE S.A.
- 6.4.10 RWE AG
- 6.4.11 Duke Energy Corporation
- 6.4.12 The Southern Company
- 6.4.13 Dominion Energy, Inc.
- 6.4.14 Exelon Corporation
- 6.4.15 National Grid plc
- 6.4.16 NTPC Limited
- 6.4.17 Korea Electric Power Corporation (KEPCO)
- 6.4.18 China Yangtze Power Co., Ltd.
- 6.4.19 Abu Dhabi National Energy Company PJSC (TAQA)
- 6.4.20 Tokyo Electric Power Company Holdings, Inc.
7 MARKET OPPORTUNITIES AND FUTURE OUTLOOK
- 7.1 White-Space and Unmet-Need Assessment


