

|
시장보고서
상품코드
2156908
애플리케이션 보안 태세 관리 : 시장 점유율 분석, 업계 동향과 통계, 성장 예측(2026-2031년)Application Security Posture Management - Market Share Analysis, Industry Trends & Statistics, Growth Forecasts (2026 - 2031) |
||||||
 Mordor Intelligence
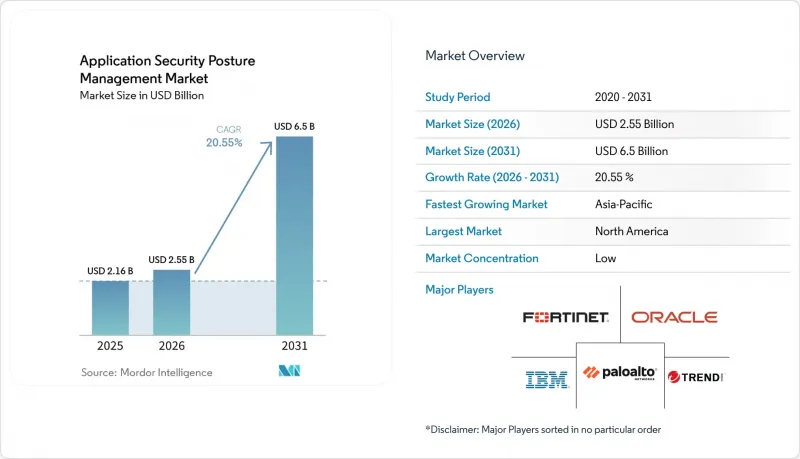
에 따르면 애플리케이션 보안 태세 관리 시장 규모는 2025년에 21억 6,000만 달러로 평가되며, 2026년 25억 5,000만 달러에서 2031년까지 65억 달러에 달할 것으로 예측되고 있으며, 예측 기간(2026-2031년)에 CAGR은 20.55%에 달할 전망입니다.
글로벌 애플리케이션 보안 태세 관리 시장의 동향 및 인사이트
규제 및 거버넌스상의 압력
여러 중복되는 사이버 보안 요구 사항으로 인해 애플리케이션 보안은 정기적인 검토 활동에서 지속적인 운영상의 책임으로 전환되고 있습니다. EU의 사이버 복원력법(Cyber Resilience Act)에서는 2026년 9월부터 실제로 악용된 취약점이나 중대한 사고에 대한 보고 의무가 도입되었습니다. DORA, NIS2, PCI DSS 4.0.1 및 NIST의 보안 소프트웨어 개발 프레임워크(Secure Software Development Framework) 역시 문서화된 보안 조치 및 사고 대비에 관한 요건을 추가하고 있습니다. 보안 팀은 최신 취약점 인벤토리와 신속하게 검색 가능한 증거를 필요로 하므로 애플리케이션 보안 태세 관리 시장은 그 혜택을 누리고 있습니다. 수동 프로세스만으로는 대규모 소프트웨어 자산 전반에 걸쳐 이러한 증거를 일관되게 생성할 수 없습니다. 또한 제품에 대한 의무가 적용되기 전에 소프트웨어 BOM(BOM) 프로그램을 수립해야 하므로, 많은 조달 주기에서 플랫폼 평가가 앞당겨지고 있습니다.
클라우드 네이티브 및 AI 지원 개발
AI를 활용한 코드 생성에서는 익숙하지 않은 종속성이나 잘못된 패키지 참조, 나아가 기존 테스트 규칙으로는 반드시 적절하게 우선순위가 지정되지 않는 보안 문제가 발생할 가능성이 있습니다. 마이크로서비스, 컨테이너, 쿠버네티스 클러스터, 서버리스 함수, 타사 패키지는 단일 애플리케이션 환경 내에 추가적인 제어 지점을 도입합니다. 따라서 애플리케이션 보안 태세 관리 시장은 소스 코드, CI/CD 파이프라인, 레지스트리 및 실행 환경 전반에 걸친 통합된 뷰에 대한 수요에 힘입어 성장하고 있습니다. 이러한 정보 소스를 연계하는 플랫폼은 실제로 악용 가능한 경로와 이론상의 경보를 구분할 수 있습니다. 팔로알토 네트웍스는 2025년 8월, 프로덕션 환경에 배포하기 전에 네이티브 및 타사 스캐너 데이터를 상호 연관시켜 통합된 위험 그래프를 생성하는 ‘Cortex Cloud ASPM’을 출시했습니다. 소프트웨어 팀이 AI를 활용한 코드를 더 대량으로 출시함에 따라 이러한 접근 방식의 중요성은 더욱 커지고 있습니다.
애플리케이션 보안 성숙도와 변경 관리 간의 격차
많은 조직에서는 기본적인 애플리케이션 보안 조치가 일관되게 시행되기 전에 보안 태세 관리를 도입하고 있습니다. 정적 테스트의 커버리지가 불충분하거나, 의존 관계가 문서화되지 않았거나, 빌드 프로세스가 불규칙할 경우 통합 플랫폼의 유용성이 제한될 수 있습니다. 팀이 신뢰할 수 있는 자산 및 파이프라인 기록을 유지하지 못하면, 애플리케이션 보안 태세 관리 시장의 확산이 지연될 수 있습니다. 또한 개발 팀은 릴리스 후 보안 검토에서 발견된 사항에 대한 공유된 지속적인 책임 체제로 전환해야 합니다. 엔지니어링 팀의 평가가 주로 릴리스 속도에 기반하여 이루어지는 경우, 이러한 전환은 어려울 수 있습니다. 조직은 플랫폼을 구매하더라도 완전한 도입을 미루는 경우가 있으며, 그 결과 얻는 가치가 저하되고 향후 업데이트 결정이 복잡해집니다.
부문 분석
2025년 구성 요소 부문에서 애플리케이션 보안 태세 관리 시장 규모의 70.16%를 소프트웨어 및 플랫폼이 차지했습니다. 기업은 위험 우선순위 지정, 정책 적용 및 규정 준수 증거 관리를 위해 단일 환경이 필요한 경우, 플랫폼을 통한 포괄적인 대응을 선호합니다. 공통 플랫폼이 있으면 테스트 툴 간에 분리되어 있는 경향이 있는 발견 사항을 연결할 수 있습니다. 또한 보안 팀이 리포지토리나 개발 그룹 간에 책임 소재를 명확하게 할당할 수 있는 수단도 제공합니다. 이러한 이점 덕분에 소프트웨어 라이선스가 애플리케이션 보안 태세 관리 업계의 주요 수익 기반으로서 계속 자리 잡고 있는 이유를 설명할 수 있습니다.
이 서비스는 2031년까지 연평균 성장률(CAGR) 22.72%로 성장할 것으로 예측되며, 이는 구성 요소 중 가장 높은 성장률입니다. 조직은 사내 팀이 툴 조정, 경고 조사, 워크플로 재설계를 수행할 시간이나 전문 지식이 부족한 경우 매니지드 지원을 이용합니다. 관리형 서비스에서는 플랫폼 라이선스와 지속적인 트리아지 및 구현 지원을 결합할 수 있습니다. 이 모델은 여러 파이프라인에 걸쳐 지속적인 증거를 필요로 하는 규제 대상 조직에 대한 접근성을 확대합니다. 또한 팀이 보안 조사 결과를 개발자가 실행 가능한 작업으로 전환할 수 있도록 지원할 수도 있습니다. 따라서 서비스의 성장은 플랫폼 도입을 대체하는 것이 아니라 이를 보완하는 것입니다.
2025년, 애플리케이션 보안 태세 관리 시장의 도입 부문에서 클라우드는 65.11%의 점유율을 차지했습니다. 클라우드 제공 방식은 이미 호스팅형 CI/CD 플랫폼, 컨테이너 레지스트리, 멀티클라우드 런타임 환경을 활용하고 있는 애플리케이션에 가장 적합합니다. 이를 통해 온프레미스 인프라의 유지 관리 및 통합 기능을 최신 상태로 유지하는 데 필요한 노력을 줄일 수 있습니다. 보안 팀은 온프레미스 도입 주기를 기다릴 필요 없이 새로운 리포지토리나 환경을 추가할 수 있습니다. 이 모델은 소프트웨어를 빈번하게 출시하는 조직에 특히 효과적입니다.
하이브리드 배포는 2031년까지 연평균 성장률(CAGR) 22.04%로 성장할 것으로 예측됩니다. 이는 클라우드 기반의 연동을 원하면서도 기밀성이 높은 취약점 텔레메트리 데이터를 특정 위치에 보관하고자 하는 조직에 대응하는 것입니다. 금융 기관, 공공기관, 방위 관련 기업 및 중요 인프라 운영 사업자 등은 연결성이나 데이터 보관 장소에 대해 더 엄격한 규정을 적용하는 경우가 있습니다. 하이브리드 아키텍처를 통해 이러한 조직은 특정 정보에 대한 로컬 관리 권한을 유지할 수 있습니다. 또한 중앙에서 관리되는 오케스트레이션 및 보고 기능에 대한 접근 권한도 유지할 수 있습니다. 애플리케이션 보안 태세 관리 시장은 완전히 클라우드 기반 환경을 넘어 도입 범위를 확대할 수 있으므로, 이러한 설계로부터 혜택을 받을 수 있습니다.
지역별 분석
2025년, 북미는 애플리케이션 보안 태세 관리 시장의 35.66% 점유율을 차지했습니다. 이 지역에는 기업의 사이버 보안 예산이 집중되어 있으며, 클라우드 및 DevSecOps 생태계도 성숙해 있습니다. 상장 기업과 금융 기관은 사이버 보안 거버넌스 및 중대한 사고 공개를 위해 신뢰할 수 있는 기록이 필요합니다. 캐나다에서는 공공 부문의 클라우드 배포과 주별 개인정보 보호 요건으로 인해 규제 대상 애플리케이션에 대한 수요가 증가하고 있습니다. 멕시코에서는 디지털 경제와 소프트웨어 서비스 활동의 활성화가 국경을 넘어 고객에게 서비스를 제공하는 기업의 수요를 지원하고 있습니다. 이러한 요인들로 인해 이 지역은 벤더의 진출, 개발자 보안 인력, 플랫폼 수준의 보안 프로그램에 대한 자금 조달 측면에서 지속적인 우위를 점하고 있습니다.
유럽은 애플리케이션 보안 태세 관리 시장에서 지역별 두 번째로 큰 기여를 했습니다. DORA, NIS2 및 사이버 복원력법의 의무 사항은 소프트웨어 제조업체와 운영 사업자에게 까다로운 환경을 조성하고 있습니다. 독일에서의 NIS2 시행은 국내에서 조기 규정 준수 계획 수립의 물결을 일으켰으며, 한편 이탈리아의 일정은 추가적인 수요 주기를 가져왔습니다. 금융 서비스 및 보험 기관은 특히 탄력적인 애플리케이션 프로세스를 문서화해야 할 필요성을 안고 있습니다. 데이터 거주지 요건 또한 하이브리드형 제공 설계에 대한 관심을 부추기고 있습니다. 조직이 글로벌 플랫폼을 각국의 규제 요건에 부합하도록 조정하는 데 지원이 필요한 경우, 이 지역의 서비스 수요는 북미보다 더 강해질 가능성이 있습니다.
아시아태평양은 2031년까지 연평균 성장률(CAGR) 21.77%로 확대될 것으로 예측되며, 애플리케이션 보안 태세 관리 시장에서 가장 높은 지역 성장률을 보이고 있습니다. 중국, 인도, 일본, 한국 및 동남아시아의 ‘클라우드 우선’ 전환으로 인해 협력적인 보안 조치가 필요한 최신 소프트웨어 환경이 증가하고 있습니다. 일본의 ‘사이버 방어법’과 싱가포르에서 개정된 ‘사이버 에센셜 마크(Cyber Essentials Mark)’ 프레임워크는 기업과 공급업체의 보다 공식적인 보안 활동을 지원하고 있습니다. HENNGE가 2025년에 ASPM 툴을 도입한 것은 클라우드 및 소프트웨어 자산 전반에 걸친 통합적인 가시성에 대한 현지 수요를 여실히 보여줍니다. 중동 및 아프리카의 기여도는 여전히 미미하지만, UAE와 사우디아라비아의 디지털 정부 프로그램으로 인해 공공 부문의 소프트웨어 공급업체에 대한 기대가 높아지고 있습니다.
기타 혜택:
- 엑셀 형식의 시장 예측(ME) 시트
- 3개월간의 애널리스트 지원
자주 묻는 질문
목차
제1장 서론
- 조사 전제조건과 시장 정의
- 조사 범위
제2장 조사 방법
제3장 개요
제4장 시장 구도
- 시장 개요
- 시장 성장 촉진요인
- 시장 성장 억제요인
- 밸류체인 분석
- 규제 상황
- 기술 전망
- Porter's Five Forces 분석
- 거시경제 요인의 영향
제5장 시장 규모와 성장 예측
- 컴포넌트별
- 배포 모델별
- 조직 규모별
- 도입 환경별
- 산업 분야별
- 지역별
- 북미
- 미국
- 캐나다
- 멕시코
- 남미
- 브라질
- 아르헨티나
- 기타 남미 국가
- 유럽
- 독일
- 영국
- 프랑스
- 이탈리아
- 베네룩스
- 기타 유럽 국가
- 아시아태평양
- 중국
- 일본
- 인도
- 한국
- 호주
- 기타 아시아태평양 국가
- 중동 및 아프리카
- 중동
- 아랍에미리트
- 사우디아라비아
- 기타 중동 국가
- 아프리카
- 남아프리카공화국
- 나이지리아
- 이집트
- 기타 아프리카 국가
- 중동
- 북미
제6장 경쟁 구도
- 시장 집중도
- 전략적 동향
- 시장 점유율 분석
- 기업 개요
- Palo Alto Networks, Inc.
- Snyk Limited
- Checkmarx Ltd.
- Wiz, Inc.
- Synopsys, Inc.
- Veracode, Inc.
- Apiiro, Ltd.
- Legit Security, Inc.
- ArmorCode, Inc.
- Cycode, Inc.
- Nucleus Security, Inc.
- OX Security, Inc.
- CrowdStrike, Inc.
- GitLab Inc.
- GitHub, Inc.
- Veracode, Inc.
- Rapid7, Inc.
- Qualys, Inc.
- IBM Corporation
- Oracle Corporation
- Fortinet, Inc.
- Trend Micro Incorporated
- Contrast Security, Inc.
- Mend.io, Inc.
- Invicti Security Corp.
- JFrog Ltd.
제7장 시장 기회와 향후 동향
- 화이트 스페이스 및 미충족 수요 평가
According to Mordor Intelligence, the application security posture management market size was valued at USD 2.16 billion in 2025 and estimated to grow from USD 2.55 billion in 2026 to reach USD 6.50 billion by 2031, at a CAGR of 20.55% during the forecast period (2026-2031).
Global Application Security Posture Management Market Trends and Insights
Regulatory and Governance Pressure
Several overlapping cybersecurity requirements are shifting application security from a periodic review activity to a continuous operational responsibility. The EU Cyber Resilience Act introduced reporting obligations for actively exploited vulnerabilities and severe incidents in September 2026. DORA, NIS2, PCI DSS 4.0.1, and the NIST Secure Software Development Framework add related demands for documented security practices and incident readiness. The application security posture management market benefits because security teams need current vulnerability inventories and evidence that can be retrieved quickly. Manual processes do not produce this evidence consistently across large software estates. Software bill-of-materials programs also need to be established before product obligations apply, which brings platform evaluations forward in many procurement cycles.
Cloud-Native and AI-Assisted Development
AI-assisted code generation can introduce unfamiliar dependencies, incorrect package references, and security findings that conventional testing rules do not always prioritize well. Microservices, containers, Kubernetes clusters, serverless functions, and third-party packages introduce additional control points within a single application estate. The application security posture management market is therefore supported by demand for a shared view across source code, CI/CD pipelines, registries, and runtime environments. Platforms that connect these sources can distinguish an exploitable path from a theoretical alert. Palo Alto Networks introduced Cortex Cloud ASPM in August 2025 to correlate native and third-party scanner data into a unified risk graph before production. This approach becomes more relevant as software teams release AI-supported code at a higher volume.
AppSec Maturity and Change-Management Gaps
Many organizations are introducing posture management before basic application security practices are consistently in place. Incomplete static testing coverage, undocumented dependencies, and irregular build processes limit the usefulness of a consolidated platform. The application security posture management market can face slower adoption when teams cannot maintain reliable asset and pipeline records. Development groups must also move from post-release security reviews to shared, continuous ownership of findings. That shift can be difficult when engineering teams are measured mainly on release speed. Organizations may purchase a platform but delay full deployment, which weakens realized value and complicates later renewal decisions.
Other drivers and restraints analyzed in the detailed report include:
- Tool-Sprawl Reduction and Risk Consolidation
- DevSecOps Workflow Integration
- Budget and ROI Scrutiny
For complete list of drivers and restraints, kindly check the Table Of Contents.
Segment Analysis
Software and platforms accounted for 70.16% of the application security posture management market size in the component segment in 2025. Enterprises favor platform coverage when they need one environment for risk prioritization, policy enforcement, and compliance evidence. A common platform can connect findings that would otherwise remain separated across testing tools. It also gives security teams a clearer way to assign ownership across repositories and development groups. These benefits explain why software licenses remain the main commercial foundation of the application security posture management industry.
Services are projected to grow at a 22.72% CAGR through 2031, the fastest rate among components. Organizations use managed support when internal teams lack the time or expertise to tune tools, investigate alerts, and redesign workflows. Managed delivery can combine a platform license with ongoing triage and implementation support. This model expands access for regulated organizations that need continuous evidence across many pipelines. It can also help teams translate security findings into work that developers can complete. Services growth, therefore, complements platform adoption rather than replacing it.
Cloud held 65.11% of the application security posture management market share in the deployment segment in 2025. Cloud delivery is well-suited to applications that already use hosted CI/CD platforms, container registries, and multi-cloud runtime environments. It can reduce the effort required to maintain local infrastructure and keep integrations up to date. Security teams can add new repositories and environments without waiting for an on-premises deployment cycle. This model is especially relevant for organizations that release software frequently.
Hybrid deployment is projected to grow at a 22.04% CAGR through 2031. It addresses organizations that want cloud-based coordination while keeping sensitive vulnerability telemetry in a specified location. Financial institutions, public-sector agencies, defense contractors, and critical infrastructure operators may impose stricter rules on connectivity and data residency. Hybrid architectures allow these organizations to preserve local control over selected information. They also retain access to centrally managed orchestration and reporting capabilities. The application security posture management market can benefit from this design, as it broadens adoption beyond fully cloud-based environments.
Complete Report Scope:
- By Component
- Software and Platforms
- Services
- By Deployment Model
- Cloud
- On-Premises
- Hybrid
- By Organization Size
- Large Enterprises
- Small and Medium-Sized Enterprises
- By Application Environment
- Web Applications
- Mobile Applications
- Other Application Environments
- By Industry Vertical
- Government and Public Administration
- Industrial Manufacturing
- Retail and E-Commerce
- Transportation and Logistics
- Energy and Utilities
- Oil and Gas
- IT and Telecommunication
- Media and Entertainment
- Education and Research Institutions
- Healthcare and Life Sciences
- Banking, Financial Services, and Insurance (BFSI)
- Other Industry Verticals
- By Geography
- North America
- United States
- Canada
- Mexico
- South America
- Brazil
- Argentina
- Rest of South America
- Europe
- Germany
- United Kingdom
- France
- Italy
- BENELUX
- Rest of Europe
- Asia-Pacific
- China
- Japan
- India
- South Korea
- Australia
- Rest of Asia-Pacific
- Middle East and Africa
- Middle East
- United Arab Emirates
- Saudi Arabia
- Rest of Middle East
- Africa
- South Africa
- Nigeria
- Egypt
- Rest of Africa
- Middle East
- North America
Geography Analysis
North America held 35.66% of the application security posture management market share in 2025. The region has a high concentration of enterprise cybersecurity budgets and a mature cloud and DevSecOps ecosystem. Public companies and financial organizations need reliable records for cybersecurity governance and material incident disclosure. Canada's public-sector cloud adoption and provincial privacy requirements add demand in regulated applications. Mexico's digital economy and software services activity support demand among firms that serve cross-border customers. These factors give the region a durable advantage in vendor presence, developer security talent, and funding for platform-level security programs.
Europe was the second-largest regional contributor to the application security posture management market. DORA, NIS2, and Cyber Resilience Act obligations create a demanding environment for software producers and operators. Germany's implementation of NIS2 created an early national wave of compliance planning, while Italy's timetable added another demand cycle. Financial services and insurance organizations have a particular need to document resilient application processes. Data residency also supports interest in hybrid delivery designs. The region's service demand can be stronger than in North America when organizations need help adapting global platforms to national obligations.
Asia-Pacific is projected to expand at a 21.77% CAGR through 2031, the fastest regional rate in the application security posture management market. Cloud-first transformation across China, India, Japan, South Korea, and Southeast Asia is increasing the number of modern software environments that require coordinated security controls. Japan's Active Cyber Defense Act and Singapore's updated Cyber Essentials Mark framework support more formal security activity among enterprises and suppliers. HENNGE's 2025 adoption of an ASPM tool illustrates local demand for consolidated visibility across cloud and software assets. The Middle East and Africa remain smaller contributors, but digital government programs in the UAE and Saudi Arabia are raising expectations for public-sector software suppliers.
- Palo Alto Networks, Inc.
- Snyk Limited
- Checkmarx Ltd.
- Wiz, Inc.
- Synopsys, Inc.
- Veracode, Inc.
- Apiiro, Ltd.
- Legit Security, Inc.
- ArmorCode, Inc.
- Cycode, Inc.
- Nucleus Security, Inc.
- OX Security, Inc.
- CrowdStrike, Inc.
- GitLab Inc.
- GitHub, Inc.
- Veracode, Inc.
- Rapid7, Inc.
- Qualys, Inc.
- IBM Corporation
- Oracle Corporation
- Fortinet, Inc.
- Trend Micro Incorporated
- Contrast Security, Inc.
- Mend.io, Inc.
- Invicti Security Corp.
- JFrog Ltd.
Additional Benefits:
- The market estimate (ME) sheet in Excel format
- 3 months of analyst support
TABLE OF CONTENTS
1 INTRODUCTION
- 1.1 Study Assumptions and Market Definition
- 1.2 Scope of the Study
2 RESEARCH METHODOLOGY
3 EXECUTIVE SUMMARY
4 MARKET LANDSCAPE
- 4.1 Market Overview
- 4.2 Market Drivers
- 4.2.1 Regulatory and Governance Pressure
- 4.2.2 Cloud-Native and AI-Assisted Development
- 4.2.3 Tool-Sprawl Reduction and Risk Consolidation
- 4.2.4 DevSecOps Workflow Integration
- 4.2.5 Code-to-Runtime Contextual Prioritization
- 4.2.6 Software Supply-Chain Visibility Requirements
- 4.3 Market Restraints
- 4.3.1 AppSec Maturity and Change-Management Gaps
- 4.3.2 Budget and ROI Scrutiny
- 4.3.3 Scarcity of AppSec and DevSecOps Talent
- 4.3.4 Data-Residency and Integration Complexity
- 4.4 Value Chain Analysis
- 4.5 Regulatory Landscape
- 4.5.1 EU Cyber Resilience Act
- 4.5.2 Digital Operational Resilience Act
- 4.5.3 NIS2 Directive
- 4.5.4 SEC Cybersecurity Disclosure Rules
- 4.5.5 PCI DSS 4.0
- 4.5.6 HIPAA Security Rule
- 4.6 Technological Outlook
- 4.6.1 AI-Assisted and Agentic Development Security
- 4.6.2 Code-to-Cloud and Runtime Correlation
- 4.6.3 Risk Graphs and Exploitability Modeling
- 4.6.4 Software Bills of Materials and Provenance
- 4.6.5 API, Container, Kubernetes, and Serverless Security
- 4.6.6 Policy-as-Code and Automated Remediation
- 4.7 Porter's Five Forces Analysis
- 4.7.1 Competitive Rivalry
- 4.7.2 Threat of New Entrants
- 4.7.3 Bargaining Power of Buyers
- 4.7.4 Bargaining Power of Suppliers
- 4.7.5 Threat of Substitutes
- 4.8 Impact of Macroeconomic Factors
- 4.8.1 Cybersecurity Budget Resilience
- 4.8.2 Cloud and Software Investment Cycles
- 4.8.3 Interest Rates and Venture Funding
- 4.8.4 Geopolitical and Data-Sovereignty Requirements
5 MARKET SIZE AND GROWTH FORECASTS (VALUES)
- 5.1 By Component
- 5.1.1 Software and Platforms
- 5.1.2 Services
- 5.2 By Deployment Model
- 5.2.1 Cloud
- 5.2.2 On-Premises
- 5.2.3 Hybrid
- 5.3 By Organization Size
- 5.3.1 Large Enterprises
- 5.3.2 Small and Medium-Sized Enterprises
- 5.4 By Application Environment
- 5.4.1 Web Applications
- 5.4.2 Mobile Applications
- 5.4.3 Other Application Environments
- 5.5 By Industry Vertical
- 5.5.1 Government and Public Administration
- 5.5.2 Industrial Manufacturing
- 5.5.3 Retail and E-Commerce
- 5.5.4 Transportation and Logistics
- 5.5.5 Energy and Utilities
- 5.5.6 Oil and Gas
- 5.5.7 IT and Telecommunication
- 5.5.8 Media and Entertainment
- 5.5.9 Education and Research Institutions
- 5.5.10 Healthcare and Life Sciences
- 5.5.11 Banking, Financial Services, and Insurance (BFSI)
- 5.5.12 Other Industry Verticals
- 5.6 By Geography
- 5.6.1 North America
- 5.6.1.1 United States
- 5.6.1.2 Canada
- 5.6.1.3 Mexico
- 5.6.2 South America
- 5.6.2.1 Brazil
- 5.6.2.2 Argentina
- 5.6.2.3 Rest of South America
- 5.6.3 Europe
- 5.6.3.1 Germany
- 5.6.3.2 United Kingdom
- 5.6.3.3 France
- 5.6.3.4 Italy
- 5.6.3.5 BENELUX
- 5.6.3.6 Rest of Europe
- 5.6.4 Asia-Pacific
- 5.6.4.1 China
- 5.6.4.2 Japan
- 5.6.4.3 India
- 5.6.4.4 South Korea
- 5.6.4.5 Australia
- 5.6.4.6 Rest of Asia-Pacific
- 5.6.5 Middle East and Africa
- 5.6.5.1 Middle East
- 5.6.5.1.1 United Arab Emirates
- 5.6.5.1.2 Saudi Arabia
- 5.6.5.1.3 Rest of Middle East
- 5.6.5.2 Africa
- 5.6.5.2.1 South Africa
- 5.6.5.2.2 Nigeria
- 5.6.5.2.3 Egypt
- 5.6.5.2.4 Rest of Africa
- 5.6.5.1 Middle East
- 5.6.1 North America
6 COMPETITIVE LANDSCAPE
- 6.1 Market Concentration
- 6.2 Strategic Moves
- 6.3 Market Share Analysis
- 6.4 Company Profiles (includes Global Level Overview, Market Level Overview, Core Segments, Financials as available, Strategic Information, Market Rank/Share, Products and Services, Recent Developments)
- 6.4.1 Palo Alto Networks, Inc.
- 6.4.2 Snyk Limited
- 6.4.3 Checkmarx Ltd.
- 6.4.4 Wiz, Inc.
- 6.4.5 Synopsys, Inc.
- 6.4.6 Veracode, Inc.
- 6.4.7 Apiiro, Ltd.
- 6.4.8 Legit Security, Inc.
- 6.4.9 ArmorCode, Inc.
- 6.4.10 Cycode, Inc.
- 6.4.11 Nucleus Security, Inc.
- 6.4.12 OX Security, Inc.
- 6.4.13 CrowdStrike, Inc.
- 6.4.14 GitLab Inc.
- 6.4.15 GitHub, Inc.
- 6.4.16 Veracode, Inc.
- 6.4.17 Rapid7, Inc.
- 6.4.18 Qualys, Inc.
- 6.4.19 IBM Corporation
- 6.4.20 Oracle Corporation
- 6.4.21 Fortinet, Inc.
- 6.4.22 Trend Micro Incorporated
- 6.4.23 Contrast Security, Inc.
- 6.4.24 Mend.io, Inc.
- 6.4.25 Invicti Security Corp.
- 6.4.26 JFrog Ltd.
7 MARKET OPPORTUNITIES AND FUTURE TRENDS
- 7.1 White-Space and Unmet-Need Assessment


