
|
시장보고서
상품코드
1816818
A2A 결제 시장(2025-2030년)A2A Payments Market: 2025-2030 |
||||||
부가가치 서비스 진화로 세계의 A2A 거래액은 2030년 195조 달러에 도달할 전망
| 주요 통계 | |
|---|---|
| 세계의 A2A 거래(2025년) : | 540억 |
| 세계의 A2A 거래(2029년) : | 10억 |
| A2A 거래 성장(2025-2030년) : | 83% |
| 예측 기간 : | 2025-2030년 |
본 조사 스위트는 급속히 변화하는 A2A 결제 시장을 상세하게 분석하고 있으며, A2A 결제 서비스 제공업체가 주요 결제 동향 및 과제, 잠재적인 성장 기회, 경쟁 환경을 이해할 수 있도록 지원합니다.
이 스위트에는 A2A 결제 시장 전망 성장을 매핑하는 데이터에 대한 액세스가 포함되어 있습니다. 자세한 조사는 시장에서 최신 기회와 동향을 밝히고 A2A 결제 서비스 제공업체 19개사의 광범위한 분석을 포함한 인사이트 자료를 제공합니다. 기존 결제 인프라와의 호환성 문제, 기업용 저비용, 고객 경험 향상 등의 측면도 보고서 전체에서 다루고 있습니다.
이러한 요소를 통해 본 스위트는 급성장하는 A2A 결제 시장을 이해하는 효과적인 도구가 되며, A2A 결제 벤더가 미래의 전략을 수립하고 고객과 비즈니스 파트너에게 효과적이고 효율적인 결제 서비스를 제공할 수 있게 합니다. 탁월한 조사 범위를 통해 이 스위트는 이 복잡한 시장 전망를 측정하는 데 매우 유용한 리소스가 될 것입니다.
주요 특징
- 시장 역학 : A2A 결제 분야에서 주요 결제 동향과 시장 확대와 관련된 과제에 대한 인사이트를 제공합니다. 각 시장의 전용 솔루션 부족, 결제 솔루션에 대한 낮은 일반 인지도, 잠재적인 부정 위험 등의 과제에 대응하여 A2A 결제가 이용되고 있는 여러 이용 사례를 분석했습니다. 또한 A2A 결제의 미래 전망에 대해서도 제시합니다.
- 주요 요점 맟 전략적 제안 : 시장에서 중요한 성장 기회와 조사 결과를 자세히 분석하고 A2A 결제 솔루션 제공업체를 향해 새로운 동향에 대한 대응과 시장의 향후 진화에 대한 전략적 제안을 제시합니다.
- 벤치마크 업계 예측 : 예측 데이터에는 A2A 결제를 매장 내, 온라인, P2P, 월경, B2B, B2C로 나눈 분석이 포함됩니다. 각 부문에 대해 거래 건수 및 평균 거래 금액 등의 지표가 표시됩니다.
- Juniper Research의 경쟁 리더보드 : A2A 결제 벤더 19개사의 능력과 대응력을 평가했습니다.
SAMPLE VIEW
시장 데이터 및 예측 보고서
샘플
시장 동향 및 전략 보고서
시장 데이터 및 예측 보고서
본 설문조사 스위트에는 70개의 테이블과 27,000개 이상의 데이터 포인트로 구성된 예측 데이터 세트에 대한 액세스가 포함되어 있습니다.
요약에는 다음 측정 항목이 포함됩니다.
- A2A 결제 거래 건수
- A2A 결제 거래액
- A2A 결제 사용자 수
이러한 측정항목은 다음 부문별로 제공됩니다.
- 점포내 결제
- 온라인 결제(전자상거래)
- P2P 결제
- 월경 소비자 결제
- B2B 결제(월경 및 국내)
- B2C 결제(월경 및 국내)
Juniper Research의 대화형 예측(Excel)에는 다음과 같은 기능이 있습니다.
- 통계 분석 : 데이터 기간 동안 모든 지역 및 국가에 대해 표시되는 특정 측정 항목을 검색할 수 있습니다. 그래프는 쉽게 변경할 수 있으며 클립보드로 내보낼 수 있습니다.
- 국가별 데이터 도구 : 이 도구를 사용하면 예측 기간 동안 모든 지역 및 국가 측정항 목을 확인할 수 있습니다. 사용자는 검색창에 표시되는 측정 항목을 필터링할 수 있습니다.
- 국가별 비교 도구 : 각 국가를 선택하고 비교할 수 있습니다. 이 도구에는 그래프를 내보내는 기능이 포함되어 있습니다.
- What-if 분석 : 5가지 대화형 시나리오를 통해 사용자는 예측 전제조건과 비교할 수 있습니다.
경쟁 리더보드 보고서
경쟁 리더보드 보고서는 주요 벤더 19개 회사의 상세한 평가와 시장에서의 위치 지정을 제공합니다. 이러한 공급업체는 용량 및 능력 평가, 제공하는 A2A 결제 제품의 범위, 경쟁업체를 벗어나는 추가 기술을 기반으로 확립된 지도자, 유력한 도전자 또는 분배자 겸 도전자에 자리잡고 있습니다.
게재 기업 :
|
|
|
목차
시장 동향 및 전략
제1장 중요 포인트 및 전략적 제안
- 중요 포인트
- 전략적 제안
제2장 시장 상황
- 서문
- A2A 결제 유형
- 주변기술
- 인스턴트 지불 레일
- 오픈뱅킹
- QR코드 결제
- NFC
- 현재 시장
- A2A 결제 시스템
- A2A 결제 동향
- 주요 촉진요인
- 새로운 동향
- A2A 결제의 장점 및 과제
- 장점
- 과제
제3장 부문 분석
- 소매, 전자상거래, 기타 서비스
- P2P
- 월경
- B2B?B2C
제4장 국가별 준비지수
- 국가별 준비 지수 : 서문
- 초점 시장
- 성장 시장
- 신흥국 시장
- 주니퍼리서치 국가별 준비지수 히트맵
경쟁 리더보드
제1장 Juniper Research 경쟁 리더보드
제2장 기업 프로파일
- 벤더 프로파일
- Aeropay
- Banked
- Brankas
- Brite Payments
- Dwolla
- Fiserv
- GoCardless
- Ivy
- Mastercard
- Plaid
- Prometeo
- Salt Edge
- Token.io
- TrueLayer
- Trustly
- Visa
- Volt
- Worldline
- Yapily
- 평가 기법
- 관련 조사
데이터 및 예측
제1장 서론 및 조사 방법
제2장 소비자 A2A : 요약
- A2A 결제의 이용자 총수
- 소비자 A2A 거래의 총수
- 소비자 A2A 거래의 총액
제3장 점포내 결제
- 점포내 A2A 결제의 이용자 총수
- 점포내 A2A 결제의 총 거래수
- 점포내 A2A 결제의 총 거래액
제4장 전자상거래의 결제
- 온라인 A2A 결제 이용자 총수
- 온라인 A2A 결제의 총 거래수
- 온라인 A2A 결제의 총 거래액
제5장 P2P 결제
- P2P A2A 결제 이용자 총수
- P2P A2A 결제의 총 거래수
- P2P A2A 결제의 총 거래액
제6장 월경 결제
- 월경 A2A 결제의 이용자 총수
- 월경 소비자 A2A 결제의 총 거래수
- 월경 소비자 A2A 결제의 총 거래액
제7장 B2B 결제
- 국내 A2A B2B 거래 총수
- 국내 A2A B2B 거래 총액
- 월경 A2A B2B 거래 총수
- 월경 A2A B2B 거래 총액
제8장 B2C 결제
- 국내 A2A B2C 거래 총수
- 국내 A2A B2C 거래 총액
- 월경 A2A B2C 거래 총수
- 월경 A2A B2C 거래 총액
'A2A Transaction Value to Reach $195 Trillion in 2030 Globally, Driven by Advanced Value-added Services'
| KEY STATISTICS | |
|---|---|
| A2A transactions globally in 2025: | 54bn |
| A2A transactions globally by 2029: | 1tn |
| Growth in A2A transactions from 2025 to 2030: | 83% |
| Forecast period: | 2025-2030 |
Overview
Our "Account-to-Account (A2A) Payments" research suite provides detailed analysis of this rapidly changing market; enabling A2A payments service providers to gain an understanding of key payment trends and challenges, potential growth opportunities, and the competitive environment.
Providing multiple options which can be purchased separately, the research suite includes access to data mapping the future growth of the A2A payments market. The detailed study reveals the latest opportunities and trends within the market and offers an insightful document containing an extensive analysis of 19 A2A payments service providers within the space. Aspects such as challenges regarding compatibility with existing payments infrastructure, lower fees for businesses, and enhanced customer experience are explored throughout the report. The coverage can also be purchased as a Full Research Suite, containing all of these elements, and includes a substantial discount.
Collectively, these elements provide an effective tool for understanding this rapidly emerging market; allowing A2A payments vendors to set out their future strategies to provide effective and efficient payment services to their customers and clients. Its unparalleled coverage makes this research suite an incredibly useful resource for gauging the future of this complex market.
All report content is delivered in the English language.
Key Features
- Market Dynamics: Insights into key payment trends and market expansion challenges within the A2A payments space. It addresses the challenges posed by a lack of dedicated solutions in different markets, limited public knowledge of the payment solution, and potential fraud risks; analysing multiple use cases where A2A payments are employed. The research also provides a future outlook on the landscape of A2A payments.
- Key Takeaways & Strategic Recommendations: In-depth analysis of key development opportunities and findings within the market, accompanied by key strategic recommendations for A2A payments solution providers on emerging trends and how the market is expected to evolve.
- Benchmark Industry Forecasts: The forecasts include data on A2A payments, split by in-store, online, peer-to-peer (P2P), cross-border, business-to-business (B2B), and business-to-consumer (B2C). These include metrics such as the number of transactions and average transaction value for each segment.
- Juniper Research Competitor Leaderboard: Key player capability and capacity assessment for 19 A2A payments vendors, via the Juniper Research Competitor Leaderboard; featuring analysis around major players in the A2A payments industry.
SAMPLE VIEW
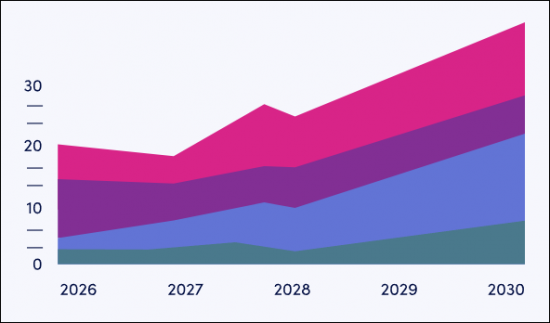
Market Data & Forecasting Report
The numbers tell you what's happening, but our written report details why, alongside the methodologies.
SAMPLE VIEW
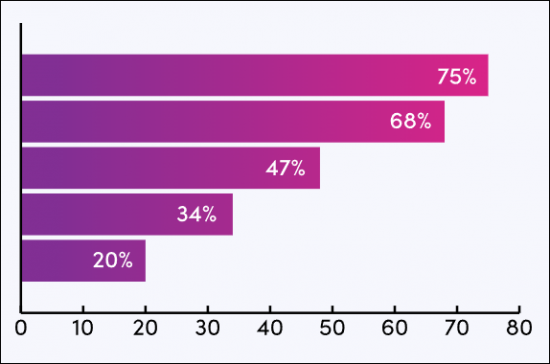
Market Trends & Strategies Report
A comprehensive analysis of the current market landscape, alongside strategic recommendations.
Market Data & Forecasting Report
The market-leading research suite for the "A2A Payments" market includes access to the full set of forecast data, consisting of 70 tables and over 27,000 datapoints.
Metrics in the research suite summary include:
- Number of A2A Payments Transactions
- Value of A2A Payments Transactions
- Number of A2A Payment Users
These metrics are also available for the following segments:
- In-store payments
- Online payments (eCommerce)
- P2P payments
- Cross-border consumer payments
- B2B payments (split by cross-border versus domestic)
- B2C payments (split by cross-border versus domestic)
The Juniper Research Interactive Forecast Excel contains the following functionality:
- Statistics Analysis: Users benefit from the ability to search for specific metrics, displayed for all regions and countries across the data period. Graphs are easily modified and can be exported to the clipboard.
- Country Data Tool: This tool allows the user to review metrics for all regions and countries in the forecast period. Users can refine the metrics displayed via the search bar.
- Country Comparison Tool: Users can select and compare each of the countries. The ability to export graphs is included in this tool.
- What-if Analysis: Here, users can compare forecast metrics against their own assumptions, via five interactive scenarios.
Market Trends & Strategies Report
This report examines the "A2A Payments" market landscape in detail. It assesses different market trends and factors that are shaping the evolution of this rapidly emerging market, such as how A2A payments are promoting financial inclusion, Open Banking and the role it is playing in driving growth of this payment method, and regulations and initiatives that are shaping adoption; advising how vendors should navigate these emerging trends.
In addition to looking at A2A payment use cases, it also includes evaluation of the different markets in which A2A payments are seeing use, and how vendors can better adapt to serve these markets.
Competitor Leaderboard Report
The Competitor Leaderboard report provides a detailed evaluation and market positioning for 19 leading vendors in the "A2A Payments" space. These vendors are positioned as an established leader, leading challenger, or disruptor and challenger, based on capacity and capability assessments, their range of A2A payment products on offer, and any additional technologies that set them apart from their competitors.
Juniper Research's Competitor Leaderboard for the "A2A Payments" market includes the following key players:
|
|
|
This document is centred around the Juniper Research Competitor Leaderboard; a vendor positioning tool that provides an at-a-glance view of the competitive landscape, backed by a robust methodology.
Table of Contents
Market Trends & Strategies
1. Key Takeaways & Strategic Recommendations
- 1.1. Key Takeaways
- 1.2. Strategic Recommendations
2. Market Landscape
- 2.1. Introduction
- 2.1.1. Types of A2A Payments
- 2.1.2. Surrounding Technologies
- i. Instant Payment Rails
- ii. Open Banking
- iii. QR Code Payments
- iv. NFC
- 2.2. Current Market
- 2.2.1. A2A Payment Systems
- Figure 2.1: Examples of National A2A Payment Schemes
- i. National Payment Schemes
- ii. Fintech Solutions
- 2.2.1. A2A Payment Systems
- 2.3. A2A Payment Trends
- 2.3.1. Key Drivers
- i. Technological Developments
- ii. Government Regulations & Initiatives
- 2.3.2. Newly-emerging Trends
- i. VRPs
- ii. QR Code Payments
- iii. Payment Interoperability
- iv. AML, Fraud, & Compliance
- 2.3.1. Key Drivers
- 2.4. Benefits & Challenges to A2A Payments
- 2.4.1. Benefits
- Figure 2.2: A2A Payments' Benefits Summary
- i. Lower Costs
- ii. Enhanced Customer Experience
- iii. Safer Instant Payments
- 2.4.2. Challenges
- Figure 2.3: A2A Payments' Challenges Summary
- i. Lack of Dedicated Solutions Across Multiple Markets
- ii. Fraud Risks
- iii. Compatibility With Pre-existing Payments Infrastructure
- iv. Banks Not Yet Convinced to Invest
- v. Limited Knowledge Restricts Progress
- 2.4.1. Benefits
3. Segment Analysis
- 3.1. Introduction
- 3.2. Retail, eCommerce, & Other Services
- Figure 3.1: Total Value of In-store & Online A2A Payments ($m), Globally, 2025-2030
- 3.3. P2P
- Figure 3.2: Total Transaction Volume of A2A-based P2P Payments (m), Split by 8 Key Regions, 2025-2030
- 3.4. Cross-border
- Figure 3.3: Global Volume of Cross-border A2A Transactions (m), Split by 8 Key Regions, 2025
- 3.5. B2B & B2C
- Figure 3.4: Total Volume of A2A-based B2B Payments (m), Globally, Split by 8 Key Regions, 2025
4. Country Readiness Index
- 4.1. Introduction to Country Readiness Index
- Figure 4.1: Juniper Research Country Readiness Index Regional Definitions
- Table 4.2: Juniper Research Country Readiness Index Scoring Criteria: A2A Payments
- Figure 4.3: Juniper Research Country Readiness Index: A2A Payments
- Figure 4.4: A2A Payments Country Readiness Index: Market Segments
- 4.1.1. Focus Markets
- i. National Payments Schemes
- Figure 4.5: Number of A2A Cross-border Transactions (m), Split by 8 Focus Markets, 2025-2030
- ii. Open Banking Adoption
- iii. A2A Payment Vendors Are Innovating Amidst High Competition
- i. National Payments Schemes
- 4.1.2. Growth Markets
- i. Instant Payment Rail (IPR) Implementation
- Figure 4.6: Number of A2A B2B Transactions (m), Split by Four Growth Markets, 2025-2030
- ii. Emerging A2A Payment Frameworks & Initiatives Pushing Growth
- i. Instant Payment Rail (IPR) Implementation
- 4.1.3. Developing Markets
- 4.2. Juniper Research A2A Payments Country Readiness Index Heatmaps
- i. North America
- Table 4.7: Juniper Research A2A Payments Country Readiness Index Heatmap: North America
- ii. Latin America
- Table 4.8: Juniper Research A2A Payments Country Readiness Index Heatmap: Latin America
- iii. West Europe
- Table 4.9: Juniper Research A2A Payments Country Readiness Index Heatmap: West Europe
- iv. Central & East Europe
- Table 4.10: Juniper Research A2A Payments Country Readiness Index Heatmap: Central & East Europe
- v. Far East & China
- Table 4.11: Juniper Research A2A Payments Country Readiness Index Heatmap: Far East & China
- vi. Indian Subcontinent
- Table 4.12: Juniper Research A2A Payments Country Readiness Index Heatmap: Indian Subcontinent
- vii. Rest of Asia Pacific
- Table 4.13: Juniper Research A2A Payments Country Readiness Index Heatmap: Rest of Asia Pacific
- viii. Africa & Middle East
- Table 4.14: Juniper Research A2A Payments Country Readiness Index Heatmap: Africa & Middle East
- i. North America
Competitor Leaderboard
1. Juniper Research Competitor Leaderboard
- 1.1. Why Read This Report?
- Table 1.1: Juniper Research Competitor Leaderboard: A2A Payment Vendors Included & Product Portfolios
- Figure 1.2: Juniper Research Competitor Leaderboard for A2A Payments Vendors
- Table 1.3: Juniper Research A2A Payments Vendors & Positioning
- Table 1.4: Juniper Research Competitor Leaderboard Heatmap for A2A Payments Vendors
2. Company Profiles
- 2.1. Vendor Profiles
- 2.1.1. Aeropay
- i. Corporate
- Table 2.1: Aeropay Funding Rounds ($m), 2017-2024
- ii. Geographical Spread
- iii. Key Clients & Strategic Partnerships
- iv. High-level View of Offerings
- v. Juniper Research's View: Key Strengths & Strategic Development Opportunities
- i. Corporate
- 2.1.2. Banked
- i. Corporate
- Table 2.2: Banked Funding Rounds ($m), 2018-2022
- ii. Geographical Spread
- iii. Key Clients & Strategic Partnerships
- iv. High-level View of Offerings
- v. Juniper Research's View: Key Strengths & Strategic Development Opportunities
- i. Corporate
- 2.1.3. Brankas
- i. Corporate
- Table 2.3: Brankas Funding Rounds ($m), 2018-2022
- ii. Geographical Spread
- iii. Key Clients & Strategic Partnerships
- iv. High-level View of Offerings
- v. Juniper Research's View: Key Strengths & Strategic Development Opportunities
- i. Corporate
- 2.1.4. Brite Payments
- i. Corporate
- Figure 2.4: Brite Payments Funding Rounds ($m), 2021 & 2023
- ii. Geographical Spread
- iii. Key Clients & Strategic Partnerships
- iv. High-level View of Offerings
- v. Juniper Research's View: Key Strengths & Strategic Development Opportunities
- i. Corporate
- 2.1.5. Dwolla
- i. Corporate
- Table 2.5: Dwolla Funding Rounds ($m), 2009-2021
- ii. Geographical Spread
- iii. Key Clients & Strategic Partnerships
- iv. High-level View of Offerings
- v. Juniper Research's View: Key Strengths & Strategic Development Opportunities
- i. Corporate
- 2.1.6. Fiserv
- i. Corporate
- Table 2.6: Fiserv, Financial Snapshot ($m), 2023-2024
- ii. Geographical Spread
- iii. Key Clients & Strategic Opportunities
- iv. High-level View of Offerings
- v. Juniper Research's View: Key Strengths & Strategic Development Opportunities
- i. Corporate
- 2.1.7. GoCardless
- i. Corporate
- Table 2.7: GoCardless, Financial Snapshot ($m), 2023-2024
- ii. Geographical Spread
- iii. Key Clients & Strategic Partnerships
- iv. High-level View of Offerings
- v. Juniper Research's View: Key Strengths & Strategic Development Opportunities
- i. Corporate
- 2.1.8. Ivy
- i. Corporate
- Table 2.8: Ivy Funding Rounds ($m), 2023
- ii. Geographical Spread
- iii. Key Clients & Strategic Partnerships
- iv. High-level View of Offerings
- v. Juniper Research's View: Key Strengths & Strategic Development Opportunities
- i. Corporate
- 2.1.9. Mastercard
- i. Corporate
- Figure 2.9: Mastercard Financial Snapshot ($m), 2023-2024
- ii. Geographical Spread
- iii. Key Clients & Strategic Partnerships
- iv. High-level View of Offerings
- v. Juniper Research's View: Key Strengths & Strategic Development Opportunities
- i. Corporate
- 2.1.10. Plaid
- i. Corporate
- Table 2.10: Plaid Funding Rounds ($m), 2013-2025
- ii. Geographical Spread
- iii. Key Clients & Strategic Partnerships
- iv. High-level View of Offerings
- v. Juniper Research's View: Key Strengths & Strategic Development Opportunities
- i. Corporate
- 2.1.11. Prometeo
- i. Corporate
- Table 2.11: Prometeo Funding Rounds ($m), 2018-2024
- ii. Geographical Spread
- iii. Key Clients & Strategic Partnerships
- iv. High-level View of Offerings
- v. Juniper Research's View: Key Strengths & Strategic Development Opportunities
- i. Corporate
- 2.1.12. Salt Edge
- i. Corporate
- Table 2.12: Salt Edge Funding Round ($m), 2018
- ii. Geographical Spread
- iii. Key Clients & Strategic Partnerships
- iv. High-level View of Offerings
- v. Juniper Research's View: Key Strengths & Strategic Development Opportunities
- i. Corporate
- 2.1.13. Token.io
- i. Corporate
- Table 2.13: Token.io Funding Rounds ($m), 2016-2025
- ii. Geographical Spread
- iii. Key Clients & Strategic Partnerships
- iv. High-level View of Offerings
- v. Juniper Research's View: Key Strengths & Strategic Development Opportunities
- i. Corporate
- 2.1.14. TrueLayer
- i. Corporate
- Table 2.14: TrueLayer Funding Rounds ($m), 2017-2024
- ii. Geographical Spread
- iii. Key Clients & Strategic Partnerships
- iv. High-level View of Offerings
- v. Juniper Research's View: Key Strengths & Strategic Development Opportunities
- i. Corporate
- 2.1.15. Trustly
- i. Corporate
- Table 2.15: Trustly Funding Rounds ($m), 2011-2020
- ii. Geographical Spread
- iii. Key Clients & Strategic Partnerships
- iv. High-level View of Offerings
- v. Juniper Research's View: Key Strengths & Strategic Development Opportunities
- i. Corporate
- 2.1.16. Visa
- i. Corporate
- Table 2.16: Visa Financial Snapshot ($m), 2023-2024
- ii. Geographical Spread
- iii. Key Clients & Strategic Partnerships
- iv. High-level View of Offerings
- v. Juniper Research's View: Key Strengths & Strategic Development Opportunities
- i. Corporate
- 2.1.17. Volt
- i. Corporate
- Table 2.17: Volt Funding Rounds ($m), 2020-2023
- ii. Geographical Spread
- iii. Key Clients & Strategic Partnerships
- iv. High-level View of Offerings
- Figure 2.18: Example of Volt Transformer Prompt
- v. Juniper Research's View: Key Strengths & Strategic Development Opportunities
- i. Corporate
- 2.1.18. Worldline
- i. Corporate
- Table 2.19: Worldline Revenue ($m), 2023-2024
- ii. Geographical Spread
- iii. Key Clients & Strategic Partnerships
- iv. High-level View of Offerings
- v. Juniper Research's View: Key Strengths & Strategic Development Opportunities
- i. Corporate
- 2.1.19. Yapily
- i. Corporate
- Table 2.20: Yapily Funding Rounds ($m), 2017-2021
- ii. Geographical Spread
- iii. Key Clients & Strategic Partnerships
- iv. High-level View of Offerings
- v. Juniper Research's View: Key Strengths & Strategic Development Opportunities
- i. Corporate
- 2.1.1. Aeropay
- 2.2. Juniper Research Leaderboard Assessment Methodology
- 2.2.1. Limitations & Interpretations
- Table 2.21: Juniper Research Competitor Leaderboard Scoring Criteria - A2A Payments
- 2.2.1. Limitations & Interpretations
- 2.3. Related Research
Data & Forecasting
1. Introduction & Methodology
- 1.1. Introduction
- 1.2. Methodology & Assumptions
- Figure 1.1: In-store A2A Payments Forecast Methodology
- Figure 1.2: eCommerce A2A Payments Forecast Methodology
- Figure 1.3: A2A-based P2P Payments Forecast Methodology
- Figure 1.4: Consumer Cross-border A2A Payments Forecast Methodology
- Figure 1.5: B2B Payments in the A2A Market Forecast Methodology
- Figure 1.6: B2C Payments in the A2A Market Forecast Methodology
2. Consumer A2A Summary
- 2.1. Total Number of A2A Payment Users
- Figure & Table 2.1: Total Number of A2A Payment Users (m), Globally, Split by 8 Key Regions, 2025-2030
- 2.2. Total Number of Consumer A2A Transactions
- Figure & Table 2.2: Total Number of Consumer A2A Transactions (m), Globally, Split by 8 Key Regions, 2025-2030
- 2.3. Total Value of Consumer A2A Transactions
- Figure & Table 2.3: Total Value of Consumer A2A Transactions ($m), Globally, Split by 8 Key Regions, 2025-2030
3. In-store Payments
- 3.1. Total Number of In-store A2A Payment Users
- Figure & Table 3.1: Total Number of In-store Payment Users (m), Globally, Split by 8 Key Regions, 2025-2030
- 3.2. Total Transaction Volume of In-store A2A Payments
- Figure & Table 3.2: Transaction Volume of In-store A2A Payments (m), Globally, Split by 8 Key Regions, 2025-2030
- 3.3. Total Transaction Value of In-store A2A Payments
- Figure & Table 3.3: Total Transaction Value of In-store A2A Payments (m), Globally, Split by 8 Key Regions, 2025-2030
4. eCommerce Payments
- 4.1. Total Number of Online A2A Payment Users
- Figure & Table 4.1: Total Number of Online A2A Payment Users (m), Globally, Split by 8 Key Regions, 2025-2030
- 4.2. Total Transaction Volume of Online A2A Payments
- Figure & Table 4.2: Total Transaction Volume of Online A2A Payments (m), Globally, Split by 8 Key Regions, 2025-2030
- 4.3. Total Transaction Value of Online A2A Payments
- Figure & Table 4.3: Total Transaction Value of Online A2A Payments ($m), Globally, Split by 8 Key Regions, 2025-2030
5. P2P Payments
- 5.1. Total Number of P2P A2A Payment Users
- Figure & Table 5.1: Total Number of P2P A2A Payment Users (m), Globally, Split by 8 Key Regions, 2025-2030
- 5.2. Total Transaction Volume of P2P A2A Payments
- Figure & Table 5.2: Total Transaction Volume of P2P A2A Payments (m), Globally, Split by 8 Key Regions, 2025-2030
- 5.3. Total Transaction Value of P2P A2A Payments
- Figure & Table 5.3: Total Transaction Value of P2P A2A Payments ($m), Globally, Split by 8 Key Regions, 2025-2030
6. Cross-border Payments
- 6.1. Total Number of Cross-border A2A Payment Users
- Figure & Table 6.1: Total Number of Cross-border A2A Payment Users (m), Globally, Split by 8 Key Regions, 2025-2030
- 6.2. Total Transaction Volume of Cross-border Consumer A2A Payments
- Figure & Table 6.2: Total Transaction Volume of Cross-border Consumer A2A Payments (m), Globally, Split by 8 Key Regions, 2025-2030
- 6.3. Total Transaction Value of Cross-border Consumer A2A Payments
- Figure & Table 6.3: Total Transaction Value of Cross-border Consumer A2A Payments ($m), Globally, Split by 8 Key Regions, 2025-2030
7. B2B Payments
- 7.1. Total Number of Domestic A2A B2B Transactions
- Figure & Table 7.1: Total Number of Domestic A2A B2B Transactions (m), Globally, Split by 8 Key Regions, 2025-2030
- 7.2. Total Value of Domestic A2A B2B Transactions
- Figure & Table 7.2: Total Value of Domestic A2A B2B Transactions ($m), Globally, Split by 8 Key Regions, 2025-2030
- 7.3. Total Number of Cross-border A2A B2B Transactions
- Figure & Table 7.3: Total Number of Cross-border A2A B2B Transactions (m), Globally, Split by 8 Key Regions, 2025-2030
- 7.4. Total Value of Cross-border A2A B2B Transactions
- Figure & Table 7.4: Total Value of Cross-border A2A B2B Transactions ($m), Globally, Split by 8 Key Regions, 2025-2030
8. B2C Payments
- 8.1. Total Number of Domestic A2A B2C Transaction
- Figure & Table 8.1: Total Number of Domestic A2A B2C Transactions (m), Globally, Split by 8 Key Regions, 2025-2030
- 8.2. Total Value of Domestic A2A B2C Transactions
- Figure & Table 8.2: Total Value of Domestic A2A B2C Transactions ($m), Globally, Split by 8 Key Regions, 2025-2030
- 8.3. Total Number of Cross-border A2A B2C Transactions
- Figure & Table 8.3: Total Number of Cross-border A2A B2C Transactions (m), Globally, Split by 8 Key Regions, 2025-2030
- 8.4. Total Value of Cross-border A2A B2C Transactions
- Figure & Table 8.4: Total Value of Cross-border A2A B2C Transactions ($m), Globally, Split by 8 Key Regions, 2025-2030

