|
시장보고서
상품코드
1851317
비디오 온디맨드 : 시장 점유율 분석, 산업 동향, 통계, 성장 예측(2025-2030년)Video-on-Demand - Market Share Analysis, Industry Trends & Statistics, Growth Forecasts (2025 - 2030) |
||||||
비디오 온디맨드 시장 규모는 2025년에 1,261억 6,000만 달러로 추정되고, 2030년에는 2,188억 9,000만 달러에 달할 것으로 예상되며, 2025-2030년의 CAGR은 11.65%를 나타낼 것으로 예측됩니다.

이 가속은 급속한 광대역 보급, 장치 보급, 보다 풍부한 컨텐츠 라이브러리에 지원되는 예정된 TV에서 온디맨드 스트리밍으로의 꾸준한 전환을 반영합니다. 북미와 서유럽에서는 초고속 섬유와 5G의 보급이 부드러운 4K 재생을 가능하게 하고, 아시아에서는 현지어 제작 예산이 지역 시청자들의 관심을 끌고 있습니다. 라틴아메리카에서는 광고가 있는 시청자층이 급증하고 가격에 민감한 가구에 새로운 진입점을 제공합니다. 시장 경쟁은 컨텐츠 독점, 교차 서비스 번들 및 비용 효율적인 배포 네트워크로 시장 리더이 해지 위험을 헤지하고 있기 때문에 여전히 치열합니다.
세계의 비디오 온디맨드 시장 동향과 인사이트
아시아태평양 신흥 시장에서 AVOD 플랫폼의 급속한 보급
아시아태평양의 시청자는 플랫폼이 저렴한 가격으로 높은 도달범위를 제공하는 광고 서비스를 수락했으며, 이 전술은 2023년에 244억 달러의 지역 동영상 수익 풀을 획득했습니다. 광고주는 14억 명의 독특한 잠재고객이 같은 해 아시아 컨텐츠를 총 140억 시간 동안 스트리밍했다고 평가합니다. 예측에서 AVOD 인벤토리 규모가 확대됨에 따라 이 지역은 2030년까지 추가로 210억 달러의 동영상 수익을 풀어 놓을 것으로 보입니다. 다국어 광고 맞춤화 및 시청자 기반 구매가 CPM을 늘리면 플랫폼은 계약 마진 감소를 상쇄할 수 있습니다. 이러한 역학이 결합되어, AVOD는 신흥 경제권의 돈을 벌기 위한 기둥으로서 보조적인 것에서 핵심적인 것으로 성장하고 있습니다.
북미와 서유럽에서 초고속 광대역 보급 확대
가정에 광섬유 확산, 5G 고정 무선 액세스, 동적 CDN 라우팅은 원활한 UHD 전송을 지원합니다. 서유럽의 OTT 에피소드와 영화 수입은 2023년 310억 달러에서 2029년까지 480억 달러로 급증할 것으로 예상됩니다. 시청자는 텔레비전, 휴대전화 및 차량용 스크린에 걸친 시작 시간 단축과 버퍼링 감소로 이익을 얻고 있습니다. 이러한 품질 업그레이드는 참여도를 높이고 비디오 온디맨드 시장의 ARPU 안정성을 직접 지원합니다.
급증하는 컨텐츠 라이선스 비용으로 플랫폼 마진 압박
히트 프랜차이즈를 둘러싼 여러 해에 걸친 입찰 경쟁은 최소 보증 금액을 올리고 서비스 수익성을 압박하고 있습니다. 일부 중견 공급자는 라이브러리를 정리하고 독점적인 히트작 구매자 또는 깊은 백 카탈로그를 수익화하는 판매자로 스스로를 자리잡고 있습니다. 유럽 위원회는 제네라티브 AI 툴이 궁극적으로 제작 비용을 완화할 수 있지만, 지출과 수익 간의 단기 불균형은 여전히 계속되고 있다고 지적하고 있는 ec.europa.eu.
부문 분석
SVOD는 2024년에 84.63%의 매출을 차지했고, 얼리 무버의 지위를 반영하고 있지만, AVOD의 11.12%의 예측 CAGR은 저비용 엔터테인먼트에 대한 수요가 가속되고 있음을 보여줍니다. AVOD로 인한 비디오 온디맨드 시장 규모는 세계 광고비가 연결 화면으로 전환됨에 따라 확대됩니다. 제한적인 광고와 겸손한 요금을 융합시킨 하이브리드 패키지가 대두해, 예측 가능한 현금 수입을 확보하면서, 구독 피로를 억제합니다. 틈새 TVOD 창은 초대작 프리미어 프로그램과의 관련성을 유지하고 스포츠의 페이퍼 뷰는 프리미엄 가격 탄력성을 유지합니다.
신흥 국가의 소비자는 AVOD를 예비 서비스가 아닌 첫 번째 선택 서비스로 취급하고 있으며 플랫폼은 광고 소재를 현지화하고 광고로드를 단축하도록 촉구합니다. 반면 광고주는 소셜 미디어에 필적하는 정밀도가 높은 타겟팅이 가능합니다. SVOD의 기존 사업자에게는 광고에 완만한 진입이 ARPU의 저하를 완화합니다. 이러한 변화는 더 광범위한 비디오 온디맨드 시장에서 고객 경험의 중심성을 변화시키지 않고 수익화 구조를 정교하게 만듭니다.
OTT 스트리밍은 2024년 수익의 72%를 차지했으며, 2030년까지의 CAGR은 11.3%를 나타낼 것으로 예측됩니다. 관리형 IPTV와 달리 OTT는 개방형 인터넷 및 적응형 비트레이트 프로토콜을 통해 전 세계적으로 확장됩니다. 최대 대역폭 수요를 최대 90% 절감하는 MAUD 평가판은 라이브 이벤트의 비용 효율성을 더욱 향상시킵니다. 따라서 OTT 채널의 비디오 온디맨드 시장 규모는 유료 방송의 VoD가 존속하더라도 레거시 케이블이나 위성 방송을 웃도는 것으로 보입니다.
IPTV는 DSL이나 광섬유가 번들되어 있는 지역에서는 여전히 정착하고 있지만, 유럽에서의 HbbTV의 채용이나 브라질의 TV 3.0은 방송의 리치와 광대역의 유연성을 융합시킨 하이브리드 모델을 강조하고 있습니다. 향후 비디오 온디맨드 업계는 엣지 컴퓨팅 노드를 통합하여 볼류메트릭 비디오와 같은 몰입형 경험을 위한 대기 시간을 단축합니다.
지역 분석
북미는 브로드밴드의 조기 보급과 오리지널 컨텐츠 파이프라인의 충실이 기여해, 2024년의 매출 점유율은 41.65%로 계속 최대가 되었습니다. 2025년에 시작된 업계 번들은 여러 주요 서비스를 할인 패키지로 결합하여 구독 피로에 해독제가 됩니다. 연방 정부의 인프라 보조금은 지역에서 광섬유 보급을 이어 비디오 온디맨드 시장의 주도적 지위를 강화합니다.
아시아태평양은 가장 빠르게 성장하고 있으며 2030년까지 연평균 복합 성장률(CAGR)은 12.2%를 나타낼 전망입니다. 5G, 클라우드, 현지어화 등의 국가적 노력이 2023년 지역별 매출액의 244억 달러에 박차를 가했습니다. 가입자 증가의 톱은 인도와 중국이며, 일본과 한국은 국제적으로 통용하는 문화적 히트작을 수출하고 있습니다. 디지털 광고비의 견조함이 성장을 더욱 뒷받침해, 신흥 경제권에서의 AVOD의 실행 가능성을 뒷받침하고 있습니다.
라틴아메리카에서는 규모가 가속화되고 있으며 2029년까지 1억 6,500만 건의 SVOD 계정을 보유할 것으로 예측됩니다. 브라질만으로도 5,900만 가입을 돌파할 수 있습니다. 통신 사업자의 파트너십은 지불을 용이하게 하고 Entel의 6억 1,800만 달러(2024년) 투자와 같은 진행 중인 광섬유 프로젝트를 통해 대역폭 요구 사항을 충족합니다. 세계 메이저가 우세하다고는 해도, 로컬 플랫폼은 여전히 8% 시장 점유율을 확보하고 있으며, 비디오 온디맨드 시장에서 지역별 스토리 수요를 반영하고 있습니다.
기타 혜택 :
- 엑셀 형식 시장 예측(ME) 시트
- 3개월간의 애널리스트 지원
목차
제1장 서론
- 조사 전제조건과 시장 정의
- 조사 범위
제2장 조사 방법
제3장 주요 요약
제4장 시장 상황
- 시장 개요
- 시장 성장 촉진요인
- 아시아태평양 신흥 시장에서 AVOD 플랫폼의 급속한 보급
- 북미·서유럽에서의 초고속 광대역 전개 확대
- 세계 스트리머에 의한 현지어 오리지널 컨텐츠에 대한 투자 확대
- VoD와 통신·유료 TV 계약의 번들이 남미에서의 보급을 촉진
- 클라우드 네이티브 CDN과 엣지 컴퓨팅의 채용 확대가 VoD의 레이턴시를 저하
- 시장 성장 억제요인
- 컨텐츠 라이선싱 비용의 상승이 플랫폼의 마진을 압박
- EU에 있어서 독점 컨텐츠 거래에 대한 독점 금지법상의 감시의 강화
- 성숙한 SVOD 시장에서의 가입 피로에 의한 해약률의 상승
- 규제 전망
- Porter's Five Forces 분석
- 구매자의 협상력
- 공급기업의 협상력
- 신규 참가업체의 위협
- 대체품의 위협
- 경쟁 기업 간 경쟁 관계
제5장 시장 규모와 성장 예측
- 사업 모델별
- 구독형 비디오 온디맨드(SVOD)
- 광고형 비디오 온디맨드(AVOD)
- 거래형/페이퍼 뷰(TVOD)
- 하이브리드 및 기타 모델
- 전달 기술별
- 오버더톱(OTT) 스트리밍
- 인터넷 프로토콜 TV(IPTV) VoD
- 유료 TV VoD
- 하이브리드 방송 브로드밴드 TV(HbbTV)
- 기기 유형별
- 스마트폰 및 태블릿
- 스마트 TV
- PC 및 노트북 PC
- 연결형 스트리밍 기기
- 기타
- 컨텐츠 장르별
- 엔터테인먼트 및 드라마
- 스포츠
- 어린이 및 가족
- 교육 및 다큐멘터리
- 기타(뉴스, 라이프스타일)
- 최종 사용자별
- 주택/개인
- 상업 및 기업(호텔, 항공사, 병원)
- 교육기관
- 공공 부문 및 정부
- 지역별
- 북미
- 미국
- 캐나다
- 멕시코
- 남미
- 브라질
- 아르헨티나
- 기타 남미
- 유럽
- 독일
- 영국
- 프랑스
- 이탈리아
- 스페인
- 기타 유럽
- 아시아태평양
- 중국
- 일본
- 한국
- 인도
- 호주
- 뉴질랜드
- 기타 아시아태평양
- 중동 및 아프리카
- 아랍에미리트(UAE)
- 사우디아라비아
- 남아프리카
- 기타 중동 및 아프리카
- 북미
제6장 경쟁 구도
- 전략적 발전
- 공급업체 포지셔닝 분석
- 기업 프로파일
- Amazon.com Inc.(Prime Video)
- Netflix Inc.
- The Walt Disney Company(Disney and Hulu)
- Warner Bros. Discovery Inc.(Max)
- Apple Inc.(Apple TV)
- Alphabet Inc.(YouTube Premium and YouTube TV)
- Comcast Corporation(Peacock and Xfinity On-Demand)
- Paramount Global(Paramount)
- Roku Inc.
- Tencent Holdings Ltd.(Tencent Video)
- Alibaba Group(Youku Tudou)
- Baidu Inc.(iQIYI)
- Zee Entertainment Enterprises Ltd.(ZEE5)
- Reliance Industries Ltd.(JioCinema)
- Novi Digital Entertainment Pvt. Ltd.(Disney Hotstar)
- KT Corporation(Olleh TV)
- Rakuten Group(Rakuten Viki)
- Sky Group Limited(NOW)
- Telstra Corporation(Telstra TV Box Office)
- PCCW Media(Viu)
- Globoplay(Grupo Globo)
- Shahid(MBC Group)
- Showmax(MultiChoice)
- Canal Group(myCanal)
- Vubiquity Inc.
제7장 시장 기회와 향후 전망
KTH 25.11.12The Video-on-Demand market size is estimated at USD 126.16 billion in 2025 and is forecast to reach USD 218.89 billion by 2030, advancing at an 11.65% CAGR over 2025-2030.
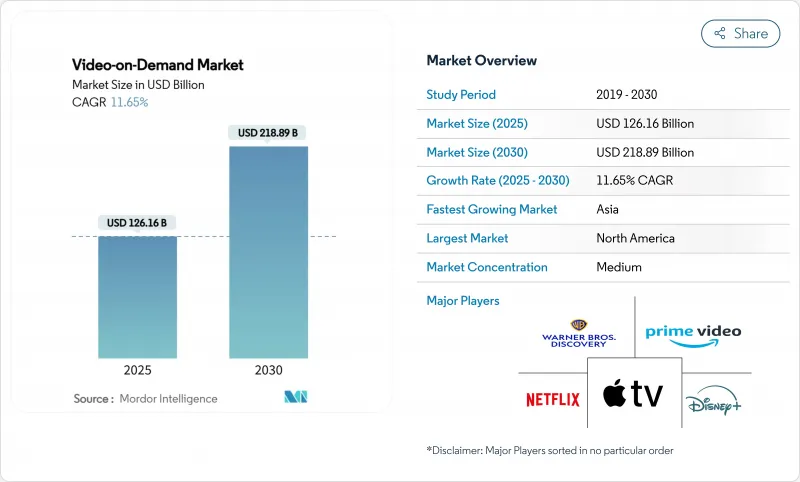
This acceleration mirrors the steady shift from scheduled television to on-demand streaming, supported by rapid broadband rollouts, device proliferation, and richer content libraries. Ultra-high-speed fiber and 5G coverage in North America and Western Europe enable smooth 4K playback, while local-language production budgets in Asia keep regional viewers engaged. The surge of ad-supported tiers offers price-sensitive households alternative entry points, and telecom bundles are lowering acquisition costs in Latin America. The competitive intensity remains high as market leaders hedge churn risk through content exclusivity, cross-service bundles, and cost-efficient delivery networks.
Global Video-on-Demand Market Trends and Insights
Rapid Adoption of AVOD Platforms in Emerging Asia-Pacific Markets
Asia-Pacific audiences are embracing ad-supported offerings as platforms trade lower fees for higher reach, a tactic that garnered a USD 24.4 billion regional video revenue pool in 2023 avia.org. Advertisers value the 1.4 billion unique viewers who collectively streamed almost 14 billion hours of Asian content in the same year avia.org. Forecasts suggest the region will unlock another USD 21 billion in video earnings by 2030 as AVOD inventory scales advanced-television.com . Multilingual ad load personalization and audience-based buying is raising CPMs, allowing platforms to offset thinner subscription margins. Together, these dynamics elevate AVOD from a supplemental to a core monetization pillar across emerging economies.
Expansion of Ultra-High-Speed Broadband Rollout in North America & Western Europe
Fiber-to-the-home penetration, 5G fixed-wireless access, and dynamic CDN routing now underpin seamless UHD delivery. Western European OTT episode and movie revenue will jump to USD 48 billion by 2029 from USD 31 billion in 2023 digitaltvnews.net . Operators are piloting multicast-assisted unicast delivery that can trim bandwidth use by as much as 90% during live traffic peaks streamtvinsider.com . Viewers benefit through faster start times and reduced buffering across TVs, phones, and in-vehicle screens. Such quality upgrades raise engagement minutes, directly supporting ARPU stability within the Video-on-Demand market.
Escalating Content Licensing Costs Squeezing Platform Margins
Multiyear bidding wars over hit franchises inflate minimum guarantees, squeezing service profitability. Some mid-tier providers have culled libraries, positioning themselves either as buyers of exclusive hits or as sellers monetizing deep back catalogs. The European Commission notes that generative AI tools could eventually ease production costs but the near-term imbalance between spending and returns persists ec.europa.eu. Consequently, operators either push prices up or introduce lower-tier plans with ads, reinforcing the two-track monetization model visible throughout the Video-on-Demand market.
Other drivers and restraints analyzed in the detailed report include:
- Increased Content Investments in Local-Language Originals by Global Streamers
- Bundling of VoD with Telecom & Pay-TV Subscriptions Driving Uptake in South America
- Rising Churn Rates Due to Subscription Fatigue in Matured SVOD Markets
For complete list of drivers and restraints, kindly check the Table Of Contents.
Segment Analysis
SVOD controlled 84.63% revenue in 2024, reflecting its early-mover status, but AVOD's 11.12% forecast CAGR signals accelerating demand for low-cost entertainment. The Video-on-Demand market size attributable to AVOD will widen as global advertising outlays migrate to connected screens. Hybrid packages that merge limited ads with modest fees are emerging to curb subscription fatigue while preserving predictable cash receipts. Niche TVOD windows retain relevance for blockbuster premieres, with sports pay-per-view sustaining premium pricing elasticity.
Consumers in emerging economies increasingly treat AVOD as a first-choice service rather than a fallback, prompting platforms to localize ad creative and shorten ad loads. Advertisers, meanwhile, gain addressable targeting that rivals social media precision. For SVOD incumbents, gradual entry into advertising mitigates ARPU erosion. Together, these shifts refine monetization structures without altering the centrality of customer experience within the broader Video-on-Demand market.
OTT streaming garnered 72% of 2024 revenues and is forecast at 11.3% CAGR through 2030. Unlike managed IPTV, OTT scales globally via open internet and adaptive bitrate protocols. MAUD trials that cut peak bandwidth needs by up to 90% further bolster cost efficiency for live events streamtvinsider.com. Thus, the Video-on-Demand market size for OTT channels will outpace legacy cable and satellite, even where Pay-TV VoD persists.
IPTV remains entrenched in regions with bundled DSL and fiber offerings, while HbbTV adoption in Europe and Brazil's upcoming TV 3.0 highlight hybrid models that blend broadcast reach with broadband flexibility advanced-television.com. Looking ahead, the Video-on-Demand industry will integrate edge compute nodes to slash latency for immersive experiences such as volumetric video.
The Video-On-Demand (VoD) Market Report is Segmented by Business Model (Subscription VoD, Advertising VoD, and More), Delivery Technology (OTT Streaming, IPTV VoD, and More), Device Type (Smartphones and Tablets, Smart TVs, and More), Content Genre (Entertainment and Drama, Sports, and More), End-User (Residential, Commercial and Enterprise, and More), and Geography. The Market Forecasts are Provided in Terms of Value (USD).
Geography Analysis
North America remained the largest contributor at 41.65% revenue share in 2024, benefiting from early broadband ubiquity and deep original-content pipelines. Industry bundles launched in 2025 combine multiple flagship services into discounted packages, an antidote to subscription fatigue. Federal infrastructure grants continue to extend rural fiber, reinforcing the Video-on-Demand market's leadership position.
Asia-Pacific is the fastest-growing territory, tracking a 12.2% CAGR to 2030. National initiatives spanning 5G, cloud, and local-language production have spurred USD 24.4 billion in 2023 regional revenue avia.org. India and China top subscriber additions, while Japan and South Korea export cultural hits that travel well internationally. Growth is further supported by robust digital advertising spend, underpinning AVOD viability across emerging economies.
Latin America shows accelerating scale, projected to host 165 million SVOD accounts by 2029 advanced-television.com. Brazil alone may surpass 59 million subs. Telco partnerships ease payments and satisfy bandwidth requirements via ongoing fiber projects such as Entel's USD 618 million 2024 investment entel.cl. Although global majors dominate, local platforms still secure 8% market share, reflecting regional storytelling demand within the Video-on-Demand market.
- Amazon.com Inc. (Prime Video)
- Netflix Inc.
- The Walt Disney Company (Disney+ and Hulu)
- Warner Bros. Discovery Inc. (Max)
- Apple Inc. (Apple TV+)
- Alphabet Inc. (YouTube Premium and YouTube TV)
- Comcast Corporation (Peacock and Xfinity On-Demand)
- Paramount Global (Paramount+)
- Roku Inc.
- Tencent Holdings Ltd. (Tencent Video)
- Alibaba Group (Youku Tudou)
- Baidu Inc. (iQIYI)
- Zee Entertainment Enterprises Ltd. (ZEE5)
- Reliance Industries Ltd. (JioCinema)
- Novi Digital Entertainment Pvt. Ltd. (Disney+ Hotstar)
- KT Corporation (Olleh TV)
- Rakuten Group (Rakuten Viki)
- Sky Group Limited (NOW)
- Telstra Corporation (Telstra TV Box Office)
- PCCW Media (Viu)
- Globoplay (Grupo Globo)
- Shahid (MBC Group)
- Showmax (MultiChoice)
- Canal+ Group (myCanal)
- Vubiquity Inc.
Additional Benefits:
- The market estimate (ME) sheet in Excel format
- 3 months of analyst support
TABLE OF CONTENTS
1 INTRODUCTION
- 1.1 Study Assumptions and Market Definition
- 1.2 Scope of the Study
2 RESEARCH METHODOLOGY
3 EXECUTIVE SUMMARY
4 MARKET LANDSCAPE
- 4.1 Market Overview
- 4.2 Market Drivers
- 4.2.1 Rapid adoption of AVOD platforms in emerging Asia-Pacific markets
- 4.2.2 Expansion of ultra-high-speed broadband rollout in North America and Western Europe
- 4.2.3 Increased content investments in local-language originals by global streamers
- 4.2.4 Bundling of VoD with telecom and pay-TV subscriptions driving uptake in South America
- 4.2.5 Growing adoption of cloud-native CDN and edge compute lowering VoD latency
- 4.3 Market Restraints
- 4.3.1 Escalating content licensing costs squeezing platform margins
- 4.3.2 Intensifying antitrust scrutiny over exclusive content deals in EU
- 4.3.3 Rising churn rates due to subscription fatigue in matured SVOD markets
- 4.4 Regulatory Outlook
- 4.5 Porter's Five Forces Analysis
- 4.5.1 Bargaining Power of Buyers
- 4.5.2 Bargaining Power of Suppliers
- 4.5.3 Threat of New Entrants
- 4.5.4 Threat of Substitutes
- 4.5.5 Intensity of Competitive Rivalry
5 MARKET SIZE AND GROWTH FORECASTS (VALUE)
- 5.1 By Business Model
- 5.1.1 Subscription Video-on-Demand (SVOD)
- 5.1.2 Advertising Video-on-Demand (AVOD)
- 5.1.3 Transactional/Pay-per-view (TVOD)
- 5.1.4 Hybrid and Other Models
- 5.2 By Delivery Technology
- 5.2.1 Over-the-Top (OTT) Streaming
- 5.2.2 Internet Protocol Television (IPTV) VoD
- 5.2.3 Pay-TV VoD
- 5.2.4 Hybrid Broadcast Broadband TV (HbbTV)
- 5.3 By Device Type
- 5.3.1 Smartphones and Tablets
- 5.3.2 Smart TVs
- 5.3.3 PCs and Laptops
- 5.3.4 Connected Streaming Devices
- 5.3.5 Others
- 5.4 By Content Genre
- 5.4.1 Entertainment and Drama
- 5.4.2 Sports
- 5.4.3 Kids and Family
- 5.4.4 Educational and Documentary
- 5.4.5 Others (News, Lifestyle)
- 5.5 By End-user
- 5.5.1 Residential / Individual
- 5.5.2 Commercial and Enterprise (Hotels, Airlines, Hospitals)
- 5.5.3 Educational Institutions
- 5.5.4 Public Sector and Government
- 5.6 By Geography
- 5.6.1 North America
- 5.6.1.1 United States
- 5.6.1.2 Canada
- 5.6.1.3 Mexico
- 5.6.2 South America
- 5.6.2.1 Brazil
- 5.6.2.2 Argentina
- 5.6.2.3 Rest of South America
- 5.6.3 Europe
- 5.6.3.1 Germany
- 5.6.3.2 United Kingdom
- 5.6.3.3 France
- 5.6.3.4 Italy
- 5.6.3.5 Spain
- 5.6.3.6 Rest of Europe
- 5.6.4 Asia-Pacific
- 5.6.4.1 China
- 5.6.4.2 Japan
- 5.6.4.3 South Korea
- 5.6.4.4 India
- 5.6.4.5 Australia
- 5.6.4.6 New Zealand
- 5.6.4.7 Rest of Asia-Pacific
- 5.6.5 Middle East and Africa
- 5.6.5.1 United Arab Emirates
- 5.6.5.2 Saudi Arabia
- 5.6.5.3 South Africa
- 5.6.5.4 Rest of Middle East and Africa
- 5.6.1 North America
6 COMPETITIVE LANDSCAPE
- 6.1 Strategic Developments
- 6.2 Vendor Positioning Analysis
- 6.3 Company Profiles (includes Global level Overview, Market level overview, Core Segments, Financials as available, Strategic Information, Products and Services, and Recent Developments)
- 6.3.1 Amazon.com Inc. (Prime Video)
- 6.3.2 Netflix Inc.
- 6.3.3 The Walt Disney Company (Disney+ and Hulu)
- 6.3.4 Warner Bros. Discovery Inc. (Max)
- 6.3.5 Apple Inc. (Apple TV+)
- 6.3.6 Alphabet Inc. (YouTube Premium and YouTube TV)
- 6.3.7 Comcast Corporation (Peacock and Xfinity On-Demand)
- 6.3.8 Paramount Global (Paramount+)
- 6.3.9 Roku Inc.
- 6.3.10 Tencent Holdings Ltd. (Tencent Video)
- 6.3.11 Alibaba Group (Youku Tudou)
- 6.3.12 Baidu Inc. (iQIYI)
- 6.3.13 Zee Entertainment Enterprises Ltd. (ZEE5)
- 6.3.14 Reliance Industries Ltd. (JioCinema)
- 6.3.15 Novi Digital Entertainment Pvt. Ltd. (Disney+ Hotstar)
- 6.3.16 KT Corporation (Olleh TV)
- 6.3.17 Rakuten Group (Rakuten Viki)
- 6.3.18 Sky Group Limited (NOW)
- 6.3.19 Telstra Corporation (Telstra TV Box Office)
- 6.3.20 PCCW Media (Viu)
- 6.3.21 Globoplay (Grupo Globo)
- 6.3.22 Shahid (MBC Group)
- 6.3.23 Showmax (MultiChoice)
- 6.3.24 Canal+ Group (myCanal)
- 6.3.25 Vubiquity Inc.
7 MARKET OPPORTUNITIES AND FUTURE OUTLOOK
- 7.1 White-space and Unmet-Need Assessment