
|
시장보고서
상품코드
2065761
B2B 결제 시장 : 시장 점유율 분석, 업계 동향 및 통계, 성장 예측(2026-2031년)B2B Payments - Market Share Analysis, Industry Trends & Statistics, Growth Forecasts (2026 - 2031) |
||||||
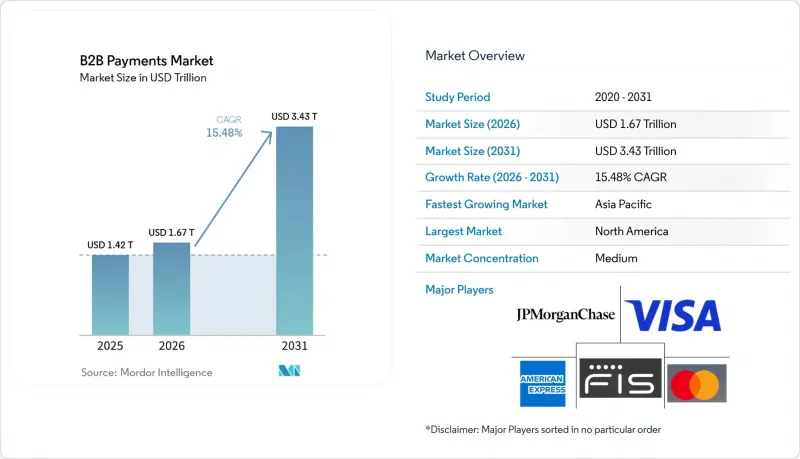
Mordor Intelligence에 의하면, B2B 결제 시장 규모는 2025년 1조 4,200억 달러로 평가되었고, 2026년에는 1조 6,700억 달러로 추정되고, 2026-2031년 CAGR 15.48%로 성장을 지속할 전망이며, 2031년에는 3조 4,300억 달러에 이를 것으로 예측됩니다.
본 보고서는 결제 유형별(국내 결제 및 국경 간 결제), 결제 수단별(기존 방식 및 디지털 방식), 기업 규모별(중소기업(SME) 및 대기업), 최종 사용자 산업 분야별(은행, 금융서비스 및 보험(BFSI), IT 및 통신, 제조, 에너지 및 유틸리티, 정부 및 공공 부문 등) 및 지역별로 분류되어 있습니다. 시장 전망은 금액(달러) 기준으로 제시되어 있습니다.
세계의 B2B 결제 시장 동향 및 인사이트
실시간 결제 인프라 도입 가속화
2023-2025년 각국 중앙은행들은 사상 가장 빠른 속도로 실시간 결제 시스템을 도입하며, 결제 확정성에 대한 기대를 새롭게 했습니다. 미국 연방준비제도이사회(FRB)의 ‘FedNow’ 서비스는 2025년 말까지 참여 기관 수가 900곳을 넘어섰습니다. 유럽의 ‘SEPA Instant’ 제도는 2024년에 145억 건의 거래를 처리하여 전년 대비 54% 증가했습니다. 인도의 ‘Unified Payments Interface(UPI)’는 2025년 12월까지 월간 134억 건의 거래를 처리했습니다. 이러한 결제 네트워크는 운전 자금의 회수 주기를 단축하여, 공급업체는 몇 초 이내에 자금을 수령할 수 있고, 구매자는 조기 결제 할인을 활용할 수 있게 됩니다. 실시간 결제 네트워크를 임베디드채무 관리 소프트웨어에 통합하는 결제 서비스 제공업체는 단순한 상품화된 처리 업체가 아니라, 전략적 재무 파트너로서의 입지를 확립해 가고 있습니다.
임베디드 결제 기능이 필요한 B2B 마켓플레이스 플랫폼의 급증
업계 특화형 소프트웨어 플랫폼은 현재 결제 원활화를 핵심 수익원으로 삼고 있습니다. Stripe사의 발표에 따르면, 자사의 내장형 금융 스택을 이용하는 벤더들의 2025년 총 처리액은 1조 달러에 달할 것으로 예상되며, 그중에서도 B2B 마켓플레이스가 가장 빠르게 성장하고 있는 부문으로 나타났습니다. 화물 거래소, 건설 포털, 도매 유통 네트워크에서는 워크플로우 내에서 직접 에스크로, 분할 결제, 동적 할인을 제공하고 있으며, 이를 통해 판매자의 매출채권 회수 기간(DSO)이 단축되고, 구매자의 수작업 대조 업무도 줄어들고 있습니다. 임베디드 금융을 통해 가맹점은 플랫폼과의 관계를 통해 서비스에 가입하게 되므로, 결제 서비스 제공업체의 고객 유치 비용이 절감됩니다. 이러한 동향은 ‘컴포저블 커머스’의 흐름과도 부합하며, 기업들은 모놀리식 ERP 제품군을 도입하는 대신 API를 통해 각 분야에서 최고의 서비스를 조합하고 있습니다.
분열된 세계의 규제 준수가 국경을 넘는 자금 흐름을 지연시키고 있습니다.
자금세탁방지(AML) 및 고객 확인(KYC)에 관한 규정이 통일되어 있지 않아, 결제 서비스 제공업체는 병행되는 온보딩 절차를 유지할 수밖에 없으며, 이로 인해 처리 시간이 24-72시간 소요되어 비용이 증가하고 있습니다. 세계은행의 추산에 따르면, 2024년 200달러 규모의 송금에 대한 평균 국제 송금 수수료는 6.35%였으며, 그 주된 요인은 규정 준수 관련 제반 비용입니다. 전 세계적으로 디지털 ID 체계가 부재하기 때문에 기업들은 신규 시장에 진출할 때 서류를 다시 제출할 수밖에 없습니다. 코레스 은행의 연쇄적 파장은 불확실성을 더욱 가중시키고 있으며, 핀테크 신생 기업들이 중개업체를 우회하는 현지 결제 시스템 네트워크를 구축하려는 움직임을 뒷받침하고 있습니다.
부문별 분석
2025년 B2B 결제 시장에서는 국내 거래가 82.89%의 점유율을 차지했으며, 시장을 주도했습니다. 이는 성숙한 국내 결제 인프라와 규제 장벽이 낮다는 점을 반영하고 있습니다. 국경을 넘는 자금 흐름은 규모는 작지만, 다국적 공급망과 B2B 마켓플레이스의 확대에 따라 연평균 성장률(CAGR) 16.52%로 증가하고 있습니다. 인도와 아랍에미리트, 혹은 싱가포르와 태국을 연결하는 신흥 결제 회랑에서는 중앙은행 디지털 통화(CBDC) 프로토타입을 활용한 실시간 결제 시범 운영이 진행되어, 결제 시간이 며칠에서 몇 초로 단축되었습니다. 다중 통화 계좌, 헤지 도구, 현지 결제 네트워크 연동 기능을 한데 묶은 서비스 제공업체는 점점 증가하는 국경을 초월한 수요를 흡수할 수 있을 것입니다.
국내 및 국제 즉시 결제 네트워크 간의 연계를 통해, 향후 가격 차이가 줄어들고 기존의 코레스 은행 모델에 압박이 가해질 가능성이 있습니다. 국경을 넘는 결제 인프라가 성숙해짐에 따라, 재무 부서는 국내에서 누리고 있는 것과 동일한 풍부한 데이터와 STP(Straight-Through Reconciliation)를 기대하게 될 것입니다. 전 세계적인 서비스 범위를 실현하는 통합 API를 제공하는 핀테크 기업들은 플랫폼형 상거래 분야에서 우선 파트너로서의 입지를 확고히 다지고 있으며, B2B 결제 시장의 이 부문에서 구조적으로 높은 성장을 뒷받침하고 있습니다.
전신송금이나 수표와 같은 기존의 결제 수단은 은행 수준의 보안과 확립된 기업 업무 흐름에 힘입어, 2025년에도 여전히 B2B 결제 시장 규모의 64.78%를 차지했습니다. 실시간 API, 카드 네트워크, 블록체인 기반 옵션 등을 포함하는 디지털 결제 채널은 연평균 성장률(CAGR) 17.31%로 성장하고 있습니다. Bill.com과 같은 클라우드 플랫폼은 2025 회계연도에 2,800억 달러의 결제 처리액을 기록했으며, 고객 결제에서 디지털 결제의 보급률은 70%를 넘어섰습니다.
ISO 20022 메시징 표준을 통해 더 다양한 데이터 필드가 가능해졌으며, 레거시 시스템과 차세대 시스템 모두에 걸친 대조 작업이 자동화되었습니다. 소프트웨어 공급업체들이 결제 오케스트레이션 기능을 통합함에 따라, 기업은 실시간 가시성을 확보하고 승인 절차를 자동화할 수 있게 되어, 수작업 처리와 부정 위험을 줄일 수 있습니다. 기능 세트의 확충을 통해 배치 파일에서의 전환이 촉진되고 있으며, B2B 결제 시장에서 디지털 채널의 점유율 확대가 지속적으로 뒷받침되고 있습니다.
지역별 분석
북미는 FedNow, 성숙한 카드 네트워크, 그리고 기업 재무에 대한 심도 있는 전문 지식을 바탕으로 2025년 거래액의 34.27%를 차지했습니다. 캐나다의 ‘Real-Time Rail’과 멕시코의 ‘CoDi’ 플랫폼은 즉시 결제 기능을 북미 대륙 전역으로 확대되고 있습니다. 핀테크 신생 기업들은 규정 준수 비용으로 인해 수수료가 6%를 초과하는 미국과 라틴아메리카 간의 국경 간 결제 경로를 목표로 삼고 있습니다.
아시아태평양은 인도의 UPI, 중국의 디지털 위안화 시범 사업, 동남아시아의 모바일 우선형 생태계의 견인 덕분에 연평균 성장률(CAGR) 17.42%를 기록하며 가장 빠르게 성장하는 지역이 될 것으로 전망됩니다. 상호 운용이 가능한 실시간 네트워크의 도입을 의무화하는 정부 규제로 인해, 현지 핀테크 기업과 세계 플랫폼 모두에게 공정한 경쟁 환경이 조성되고 있습니다.
유럽에서는 SEPA 즉시 결제의 보급 범위 확대와 조만간 시행될 전자 부가가치세(VAT) 의무화가 호재로 작용하여, 독일, 프랑스, 네덜란드 전역에서 도입이 촉진되고 있습니다. 영국의 ‘Faster Payments’는 여전히 업계의 기준이 되고 있으며, Revolut과 같은 핀테크 기업들이 재무 관리 도구를 통합할 수 있도록 하고 있습니다. 중동과 남미에서는 중앙은행 디지털 화폐(CBDC) 시범 사업에 대한 투자가 진행되고 있는 반면, 아프리카에서는 진척 상황에 차이가 나타나고 있으며, 남아프리카공화국에서는 현대화가 진행되는 반면, 기타 지역에서는 모바일 머니가 주류를 이루고 있습니다. 전반적으로, 각 지역의 정책 조치는 즉시 결제로 수렴되고 있으며, 이는 B2B 결제 시장의 장기적인 성장을 뒷받침하고 있습니다.
기타 혜택 :
- 엑셀 형식 시장 예측(ME) 시트
- 3개월간의 애널리스트 지원
자주 묻는 질문
목차
제1장 서론
제2장 조사 방법
제3장 주요 요약
제4장 시장 구도
제5장 시장 규모 및 성장 예측
제6장 경쟁 구도
제7장 시장 기회 및 향후 전망
LSH 26.06.24According to Mordor Intelligence, the b2B payments market size is expected to grow from USD 1.42 trillion in 2025 to USD 1.67 trillion in 2026 and is forecast to reach USD 3.43 trillion by 2031 at a 15.48% CAGR over 2026-2031.

This report is Segmented by Payment Type (Domestic Payments, and Cross-Border Payments), Payment Mode (Traditional Mode, and Digital Mode), Enterprise Size (Small and Medium Enterprises (SMEs), and Large Enterprises), End-User Vertical (BFSI, IT and Telecom, Manufacturing, Energy and Utilities, Government and Public Sector, and More), and Geography. The Market Forecasts are Provided in Terms of Value (USD).
Global B2B Payments Market Trends and Insights
Acceleration Of Real-Time Payment Infrastructure Adoption
Central banks deployed instant-settlement rails at record speed between 2023 and 2025, resetting expectations around payment finality. The United States Federal Reserve's FedNow Service exceeded 900 participating institutions by late 2025. Europe's SEPA Instant scheme handled 14.5 billion transactions in 2024, up 54% year on year. India's Unified Payments Interface processed 13.4 billion monthly transactions by December 2025. These rails compress working-capital cycles, enabling suppliers to receive funds within seconds and buyers to capture early-payment discounts. Payment providers embedding real-time rails into accounts-payable software are positioning as strategic treasury partners rather than commoditized processors.
Surge In B2B Marketplace Platforms Demanding Embedded Payment Capabilities
Vertical software platforms now treat payment facilitation as a core revenue stream. Stripe disclosed that software vendors using its embedded-finance stack processed USD 1 trillion in volume during 2025, with B2B marketplaces the fastest-growing cohort. Freight exchanges, construction portals, and wholesale distribution networks offer escrow, split disbursements, and dynamic discounting directly in workflow, shrinking Days Sales Outstanding for sellers and reducing manual reconciliation for buyers. Embedded finance lowers customer-acquisition costs for payment providers since merchants onboard through the platform relationship. The trend dovetails with composable commerce, where enterprises assemble best-of-breed services via APIs rather than deploying monolithic ERP suites.
Fragmented Global Compliance Slows Cross-Border Flows
Inconsistent anti-money-laundering and know-your-customer rules oblige payment providers to maintain parallel onboarding flows, adding 24-72 hours to processing times and inflating costs. The World Bank calculated average cross-border transfer fees at 6.35% for a USD 200 remittance in 2024, with compliance overhead a major driver. Lack of a global digital-identity framework forces enterprises to resubmit documents when entering new markets. Correspondent-banking chains add further opacity, encouraging fintech challengers to build local clearing-system networks that bypass intermediaries.
Other drivers and restraints analyzed in the detailed report include:
- Regulatory Push Toward Digital Invoicing And E-VAT In Europe
- Working-Capital Optimization Initiatives Driving Corporate And Virtual Card Uptake
- Persistent Payment Fraud And Business Email Compromise Undermines Digital Trust
For complete list of drivers and restraints, kindly check the Table Of Contents.
Segment Analysis
Domestic transactions dominated the B2B payments market in 2025 with an 82.89% share, reflecting mature local rails and lower regulatory friction. Cross-border flows, though smaller, are expanding at a 16.52% CAGR as multinational supply chains and B2B marketplaces proliferate. Emerging payment corridors linking India and the United Arab Emirates or Singapore and Thailand have piloted instant settlement using central-bank digital-currency prototypes, cutting settlement from days to seconds. Providers that bundle multi-currency accounts, hedging tools, and local-clearing connectivity stand to capture rising cross-border demand.
Linkages between domestic and international instant networks may narrow pricing differentials over time, pressuring legacy correspondent-banking models. As cross-border rails mature, treasury teams will expect the same data richness and straight-through reconciliation they enjoy domestically. Fintechs offering unified application-programming-interfaces for global coverage are positioning as preferred partners for platform-based commerce, reinforcing structurally higher growth for this segment of the B2B payments market.
Traditional modes such as wires and checks still accounted for 64.78% of the B2B payments market size in 2025, underpinned by perceived bank-level security and entrenched enterprise workflows. Digital rails, encompassing real-time APIs, card networks, and blockchain-based options, are growing at a 17.31% CAGR. Cloud platforms like Bill.com processed USD 280 billion in fiscal-2025 volume, with digital penetration above 70% of client payments.
ISO 20022 messaging standards are enabling richer data fields that automate reconciliation across both legacy and next-generation systems. As software vendors embed payment orchestration, enterprises gain real-time visibility and can automate approval flows, reducing manual touchpoints and fraud exposure. The expanding feature set encourages migration away from batch files, supporting sustained share gains for digital channels within the B2B payments market.
Geography Analysis
North America held 34.27% of 2025 transaction value, supported by FedNow, mature card networks, and deep corporate-treasury expertise. Canada's Real-Time Rail and Mexico's CoDi platform extend instant-payment capability across the continent. Fintech challengers target cross-border United States-Latin America corridors, where compliance costs lift fees above 6%.
Asia-Pacific is projected to be the fastest-growing region at 17.42% CAGR, fueled by India's UPI, China's digital-yuan pilots, and Southeast Asia's mobile-first ecosystems. Government mandates for interoperable real-time networks create a level playing field for local fintechs and global platforms alike.
Europe benefits from SEPA Instant reachability and impending e-VAT mandates, stimulating adoption across Germany, France, and the Netherlands. The United Kingdom's Faster Payments remains a benchmark, enabling fintechs such as Revolut to embed treasury tools. The Middle East and South America invest in central-bank digital-currency pilots, while Africa shows mixed progress, with South Africa's modernization contrasting with mobile-money dominance elsewhere. Collectively, regional policy actions are converging toward instant settlement, reinforcing the long-run expansion of the B2B payments market.
- Visa Inc.
- Mastercard Incorporated
- American Express Company
- JPMorgan Chase and Co.
- Fidelity National Information Services, Inc. (FIS Global)
- Fiserv, Inc.
- Global Payments Inc.
- Stripe, Inc.
- Adyen N.V.
- Block, Inc. (Square)
- PayPal Holdings, Inc.
- Payoneer Global Inc.
- Flywire Corporation
- Coupa Software Incorporated
- Bill.com Holdings Inc.
- SAP SE
- Bottomline Technologies, Inc.
- Airwallex (Hong Kong) Limited
- Currencycloud Group Limited
- Wise Plc
- Rapyd Financial Networks Ltd.
- Paystand, Inc.
- Capital One Financial Corporation
- Bank of America Corporation
- Traxpay GmbH
Additional Benefits:
- The market estimate (ME) sheet in Excel format
- 3 months of analyst support
TABLE OF CONTENTS
1 INTRODUCTION
- 1.1 Study Assumptions and Market Definition
- 1.2 Scope of the Study
2 RESEARCH METHODOLOGY
3 EXECUTIVE SUMMARY
4 MARKET LANDSCAPE
- 4.1 Market Overview
- 4.2 Market Drivers
- 4.2.1 Acceleration of Real-Time Payment Infrastructure Adoption
- 4.2.2 Surge in B2B Marketplace Platforms Demanding Embedded Payment Capabilities
- 4.2.3 Regulatory Push Toward Digital Invoicing and e-VAT in Europe
- 4.2.4 Working-Capital Optimization Initiatives Driving Corporate and Virtual Card Uptake
- 4.2.5 Tokenized Deposits and Regulated Stablecoins Enabling 24/7 Treasury Settlement
- 4.2.6 GenAI-Powered Autonomous Payables and Receivables Agents Lowering Back-Office Costs
- 4.3 Market Restraints
- 4.3.1 Fragmented Global Compliance (FX, AML, KYC) Slows Cross-Border Flows
- 4.3.2 Persistent Payment Fraud and Business Email Compromise Undermines Digital Trust
- 4.3.3 ERP Integration Complexity for Mid-Market Enterprises
- 4.3.4 Interoperability Gaps Between Emerging Tokenized Money Rails and Legacy Systems
- 4.4 Industry Value Chain Analysis
- 4.5 Regulatory Landscape
- 4.6 Technological Outlook
- 4.7 Porter's Five Forces Analysis
- 4.7.1 Bargaining Power of Suppliers
- 4.7.2 Bargaining Power of Buyers
- 4.7.3 Threat of New Entrants
- 4.7.4 Threat of Substitutes
- 4.7.5 Intensity of Competitive Rivalry
- 4.8 Investment and Funding Analysis
- 4.9 Assessment of Macroeconomic Factors on the Market
5 MARKET SIZE AND GROWTH FORECASTS (VALUE)
- 5.1 By Payment Type
- 5.1.1 Domestic Payments
- 5.1.2 Cross-Border Payments
- 5.2 By Payment Mode
- 5.2.1 Traditional
- 5.2.2 Digital
- 5.3 By Enterprise Size
- 5.3.1 Small and Medium Enterprises (SMEs)
- 5.3.2 Large Enterprises
- 5.4 By End-User Vertical
- 5.4.1 Banking, Financial Services and Insurance (BFSI)
- 5.4.2 Information Technology and Telecom
- 5.4.3 Manufacturing
- 5.4.4 Energy and Utilities
- 5.4.5 Government and Public Sector
- 5.4.6 Other End-User Verticals
- 5.5 By Geography
- 5.5.1 North America
- 5.5.1.1 United States
- 5.5.1.2 Canada
- 5.5.1.3 Mexico
- 5.5.2 Europe
- 5.5.2.1 United Kingdom
- 5.5.2.2 Germany
- 5.5.2.3 France
- 5.5.2.4 Italy
- 5.5.2.5 Rest of Europe
- 5.5.3 Asia-Pacific
- 5.5.3.1 China
- 5.5.3.2 Japan
- 5.5.3.3 India
- 5.5.3.4 South Korea
- 5.5.3.5 Rest of Asia-Pacific
- 5.5.4 South America
- 5.5.4.1 Brazil
- 5.5.4.2 Argentina
- 5.5.4.3 Rest of South America
- 5.5.5 Middle East
- 5.5.5.1 United Arab Emirates
- 5.5.5.2 Saudi Arabia
- 5.5.5.3 Rest of Middle East
- 5.5.6 Africa
- 5.5.6.1 South Africa
- 5.5.6.2 Rest of Africa
- 5.5.1 North America
6 COMPETITIVE LANDSCAPE
- 6.1 Market Concentration
- 6.2 Strategic Moves
- 6.3 Market Share Analysis
- 6.4 Company Profiles (includes Global Level Overview, Market Level Overview, Core Segments, Financials as available, Strategic Information, Market Rank/Share, Products and Services, Recent Developments)
- 6.4.1 Visa Inc.
- 6.4.2 Mastercard Incorporated
- 6.4.3 American Express Company
- 6.4.4 JPMorgan Chase and Co.
- 6.4.5 Fidelity National Information Services, Inc. (FIS Global)
- 6.4.6 Fiserv, Inc.
- 6.4.7 Global Payments Inc.
- 6.4.8 Stripe, Inc.
- 6.4.9 Adyen N.V.
- 6.4.10 Block, Inc. (Square)
- 6.4.11 PayPal Holdings, Inc.
- 6.4.12 Payoneer Global Inc.
- 6.4.13 Flywire Corporation
- 6.4.14 Coupa Software Incorporated
- 6.4.15 Bill.com Holdings Inc.
- 6.4.16 SAP SE
- 6.4.17 Bottomline Technologies, Inc.
- 6.4.18 Airwallex (Hong Kong) Limited
- 6.4.19 Currencycloud Group Limited
- 6.4.20 Wise Plc
- 6.4.21 Rapyd Financial Networks Ltd.
- 6.4.22 Paystand, Inc.
- 6.4.23 Capital One Financial Corporation
- 6.4.24 Bank of America Corporation
- 6.4.25 Traxpay GmbH
7 MARKET OPPORTUNITIES AND FUTURE OUTLOOK
- 7.1 White-Space and Unmet-Need Assessment

