
|
시장보고서
상품코드
2072729
매출 마케팅 서비스 시장 : 시장 점유율 분석, 업계 동향 및 통계, 성장 예측(2026-2031년)Revenue Marketing Services Market - Market Share Analysis, Industry Trends & Statistics, Growth Forecasts (2026 - 2031) |
||||||
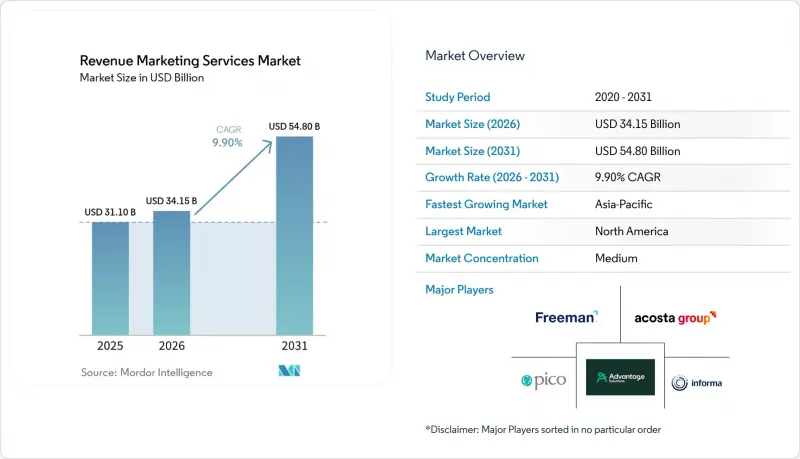
Mordor Intelligence에 의하면, 매출 마케팅 서비스 시장 규모는 2025년 311억 달러로 평가되었고, 2026년 341억 5,000만 달러로 추정되고, 2031년까지 548억 달러로 확대될 것으로 예측되며, 2026-2031년 연평균 복합 성장률(CAGR)은 9.90%를 나타낼 전망입니다.

본 보고서는 서비스 유형별(전략 및 프로그램 설계, 현장 실행 및 인력 배치 등), 최종 사용자 산업 분야별(소매 및 전자상거래, 소비재 및 미용 등), 참여 형태별(대면 프로그램, 하이브리드 프로그램 등), 캠페인 목적별(고객 확보, 리드 생성 등) 및 지역별로 분류되어 있습니다. 시장 전망은 금액(달러) 기준으로 제시되어 있습니다.
세계의 수익 마케팅 서비스 시장 동향 및 인사이트
측정 가능한 체험형 ROI에 대한 수요 증가
수익 마케팅 서비스 시장에서는 측정 가능한 이벤트 및 현장 활동의 성과에 대한 수요가 증가하고 있습니다. 이는 재무 부서가 더 이상 라이브 액티베이션을 수익 검토 대상에서 제외되는 지출로 취급하지 않게 되었기 때문입니다. 이벤트 팀은 방문객의 행동을 CRM 및 파이프라인 보고서와 연계하는 능력을 향상시키고 있으며, 2026년에도 주최사의 40%가 ROI 입증에 어려움을 겪고 있다고 보고하고 있지만, 이는 2025년의 70%에서 감소한 수치입니다. 이러한 개선은 단순히 지출 수준뿐만 아니라 조사 방법 자체도 수익 마케팅 서비스 시장에서 구매자의 신뢰를 변화시키고 있음을 보여주며, 중요한 의미를 지닙니다. 중소규모 브랜드에서도 예산 심사가 엄격해지고 있어, 계약 갱신 시에는 표준화된 보고서와 설득력 있는 기여도 분석이 더욱 중요해지고 있습니다. 이벤트에 대한 참여도가 파이프라인의 진전과 고객 유지에 어떻게 연결되는지를 보여줄 수 있는 공급업체는 수익 마케팅 서비스 시장에서 더욱 견고한 입지를 다져가고 있습니다. 여전히 독립된 이벤트 대시보드나 수작업으로 작성된 요약 파일에 의존하고 있는 공급업체는 운영 품질이 양호하더라도 계약 갱신에 대한 위험이 높아지고 있습니다.
옴니채널 및 대면 채널의 결합 확대
수익 마케팅 서비스 시장은 더 이상 디지털과 오프라인 예산 간의 단순한 상충 관계에 의해 형성되는 것이 아닙니다. 왜냐하면 많은 고객사가 현재 동일한 프로그램 내에서 서로 다른 역할을 맡고 있는 양쪽 모두에 동시에 자금을 투입하고 있기 때문입니다. 오프라인 활성화에 있어 디지털 신호를 창출하는 역할이 점점 더 기대되는 반면, 디지털 채널은 라이브 프로그램에 대한 후속 조치, 리타게팅 및 측정 범위를 확대하기 위해 활용되고 있습니다. 이로 인해 수익형 마케팅 서비스 시장의 운영 모델이 변화하고 있습니다. 왜냐하면 현장 팀은 활성화 활동 진행 중에 QR 코드 교환, 동의 획득, 실시간 후속 조치 업무를 지원해야 하는 상황이 되었기 때문입니다. 『France Pub』의 보고서에 따르면, 2025년 프랑스 광고 시장은 위축되었으나, 이벤트 및 체험형 마케팅은 다른 오프라인 부문을 능가하는 실적을 올렸다고 합니다. 이는 브랜드가 오프라인 전략을 포기하는 것이 아니라, 측정 가능성이 더 높은 오프라인 매장에서의 고객 참여로 지출을 전환하고 있다는 관점을 뒷받침하는 것입니다. 그 결과, 서비스 제공업체는 기존의 이벤트만 운영하는 방식에서 벗어나, 대면과 디지털을 융합한 업무 흐름에 대응할 수 있도록 직원 교육을 실시해야 합니다. 이러한 변화로 인해 대면 접촉이 여전히 필수적인 반면, 고객들이 디지털 프로그램의 도달 범위와 데이터 분석 능력도 요구하는 분야에서 수익 마케팅 서비스 시장의 성장이 촉진되고 있습니다.
예산 검토 및 수익성 검증 기간의 장기화
대면형 프로그램은 최종 매출이나 전환 결과가 드러나기까지 디지털 미디어보다 더 많은 시간이 소요되는 경우가 많기 때문에 예산 심사가 수익형 마케팅 서비스 시장의 성장을 저해하는 주요 요인으로 작용하고 있습니다. 마케팅 팀은 사내 심사가 엄격해지는 가운데 업무를 수행하고 있으며, 'CMO Survey' 보고서에 따르면, 2026년에는 교육 예산이 마케팅 지출의 3.8%로 감소했으며, 인력 증원도 전년 대비 크게 둔화되었다고 합니다. 이러한 환경으로 인해 수익 마케팅 서비스 시장 전반에서 조달 주기의 장기화, 시범 운영 요건 증가, 프로그램 진행 중 실적 평가 증가와 같은 경향이 나타나고 있습니다. 이 문제는 구조적인 문제입니다. 이는 소매 판매 실적, 재구매, CRM 전환율이 프로그램 종료 후 가시화되기까지 60-90일이 소요되는 경우가 많기 때문입니다. 이러한 시기는 보다 신속한 성과 입증을 요구하고 재무 부서가 수용하기 쉬운 서류를 요구하는 현재의 승인 절차와 상충될 가능성이 있습니다. 작업을 마일스톤으로 나누고, 재무팀이 수용하기 쉬운 형식으로 진행 상황을 보고할 수 있는 공급업체는 수익 마케팅 서비스 시장에서 예산을 확보하기 쉬운 입장에 있습니다.
부문별 분석
2025년, 현장 실행 및 인력 배치 부문은 수익 마케팅 서비스 시장 점유율의 27.74%를 차지했습니다. 이는 거의 모든 하위 서비스 범주에서 운영 기반으로서의 역할을 반영하고 있습니다. 제품 시연, 로드쇼, 매장 내 프로모션, 판매 지원은 모두 각 거점에 훈련을 받은 인력이 지속적으로 배치되는 것에 의존하고 있기 때문에 이 부문은 여전히 핵심적인 위치를 차지하고 있습니다. 수익 마케팅 서비스 시장에서 이러한 주도적인 입지는 임금 상승 압력, 노동 플랫폼의 변화, 그리고 클라이언트가 자가 신고에 기반한 활동 기록이 아닌 디지털 방식으로 검증된 실적을 요구한다는 점과 같은 과제에 더욱 노출되는 것을 수반합니다. 어드밴티지 솔루션즈는 2026년 1분기에 이벤트 수가 20% 가까이 증가했고, 실행률이 94%로 향상되었다고 보고했으며, 이는 통합된 인력 관리와 대규모의 지속적인 기술 업그레이드의 가치를 보여줍니다. '측정 및 분석'은 2026-2031년 연평균 성장률(CAGR) 14.26%를 기록하며 가장 빠르게 성장하고 있는 서비스 유형으로, 실적이 검증된 아키텍처가 구매 결정의 핵심 요소로 부상하고 있음을 보여줍니다.
'전략 및 프로그램 설계'는 수익 마케팅 서비스 업계에서 여전히 고가대를 유지하고 있지만, 일반적으로 단독으로가 아니라 실행 서비스와 세트로 도입되기 때문에 그 취급량은 비교적 적습니다. '소매 머천다이징 및 매장 내 프로모션'은 진열대 관련 규정 준수의 엄격화와 매장 차원의 보고 체계 강화를 요구하는 소매업체와 브랜드 간의 책임 분담 계약을 통해 계속해서 혜택을 보고 있습니다. 이벤트 및 로드쇼 관리, 리드 창출 및 영업 지원, 제품 시연 및 샘플 제공은 수익 창출 마케팅 서비스 시장에서 여전히 매력적인 분야이지만, 이러한 분야는 세분화되어 있으며, 실행과 성과를 연계하는 능력이 점점 더 중요시되고 있습니다. 따라서 인건비, 워크플로우 시스템, 분석, 고객용 보고서를 하나의 패키지로 제공할 수 있는 서비스 제공업체는 단순히 실행 서비스만 판매하는 벤더보다 더 지속적인 가격 경쟁력을 확보해 가고 있습니다.
2025년 수익 마케팅 서비스 시장 규모에서 소매 및 전자상거래 부문은 30.16%의 점유율을 차지했으며, 이는 진열대 가시성, 판매 시점 전환율, 거래 파트너 지원에 대한 경쟁이 여전히 지속되고 있음을 반영합니다. 이러한 추세는 소매 업계의 치열한 경쟁과 밀접한 관련이 있으며, 브랜드들은 여전히 상품 구성, 규정 준수 및 소비자의 의사 결정에 영향을 미치기 위해 매장이나 현장에 인력을 배치해야 합니다. 소비재 및 미용 분야도 중요도 면에서 이에 근소한 차이로 뒤를 잇고 있습니다. 이는 체험에 대한 반응이 매우 민감한 카테고리에서 시제품 제공이나 시연이 신제품 출시 지원 및 재구매 전략의 핵심으로 계속 자리 잡고 있기 때문입니다. IT, 통신 및 BFSI(은행 및 금융 및 보험) 분야에서는 B2B 행사, 로드쇼, 리드 생성, 파이프라인 진척 상황을 더욱 중시하는 등, 수익 마케팅 서비스 시장을 각기 다른 방식으로 활용하고 있습니다. 헬스케어 및 생명과학 분야는 2026-2031년 연평균 성장률(CAGR) 15.44%를 기록할 전망이며, 가장 빠르게 성장하고 있는 최종 사용자 부문입니다. 이는 오랫동안 의료 전문가에 대한 접근이 제한되어 온 이후, 규정 준수를 바탕으로 한 옴니채널 참여가 얼마나 빠르게 최우선 과제로 부상하고 있는지를 보여줍니다.
Real Chemistry사는 2025년 매출이 5억 6,000만 달러로 평가되었습니다. 2024년 대비 14% 성장했다고 보고했으며, AI를 활용한 서비스 제공과 정밀 미디어 서비스 확충을 통해 2026년에는 이러한 성장세가 더욱 가속화될 것이라고 밝혔습니다. 이 사례가 중요한 이유는 전문성이 높은 헬스케어 서비스 제공업체라면 수익 창출 마케팅 서비스 시장에서 종합 기업들이 종종 관리에 어려움을 겪는 규제상의 복잡성에도 대응할 수 있기 때문입니다. HIPAA, GxP 기준 및 카테고리별 마케팅 규정은 규정 준수 부담을 가중시키지만, 동시에 진입 장벽을 형성하여 수익 창출형 마케팅 서비스 업계에서 역량을 갖춘 기업들에게 더 높은 이익률을 뒷받침하는 요인이 됩니다. 미디어 및 엔터테인먼트, 교육, 여행 및 호스피탈리티, 산업, 자동차 등 각 업계에서도 계속해서 수익 마케팅 서비스를 적극적으로 활용하고 있지만, 그 실행 일정, 측정 프레임워크 및 구매자의 우선순위는 카테고리마다 다릅니다.
지역별 분석
2025년, 북미는 수익형 마케팅 서비스 시장 점유율의 46.30%를 차지했으며, 이 지역은 전 세계적으로 1위 자리를 유지하고 있습니다. 미국은 성숙한 아웃소싱형 현장 마케팅 체계, 소매업체와 브랜드 간의 긴밀한 공동 투자 모델, 그리고 활발한 B2B 행사 활동을 바탕으로 지역 수요의 상당 부분을 차지하고 있습니다. 캐나다도 비슷한 수요 패턴을 보이고 있지만, 그 규모는 더 작습니다. 한편, 멕시코에서는 조직화된 소매업의 확대와 다국적 소비재 브랜드들의 현장 운영에 대한 투자 증가에 힘입어 시장이 지속적으로 발전하고 있습니다. 수익 마케팅 서비스 시장에서 북미는 예산 관리가 가장 엄격한 지역이기도 합니다. 이는 마케팅 팀이 인력과 지출을 더욱 엄격하게 관리하는 체제 하에서 운영되고 있기 때문입니다. 또한, 이 지역에서는 개인정보 보호 규정 준수의 중요성이 커지고 있으며, 이로 인해 라이브 프로그램에서의 데이터 처리 비용과 복잡성이 증가하고 있습니다.
유럽은 수익형 마케팅 서비스 시장에서 여전히 2위 지역 블록으로 자리 잡고 있으며, 독일과 영국의 확고한 B2B 행사 인프라와 프랑스 및 이탈리아의 FMCG(일용소비재) 및 뷰티 브랜드로부터의 강력한 체험형 마케팅 수요에 힘입고 있습니다. 또한, 이 지역은 옴니채널을 통한 활성화 수요가 폭넓은 기반을 갖추고 있다는 점도 강점으로 작용하고 있으며, 오프라인 매장에서의 고객 참여에 대해서는 단순한 브랜드 노출에 그치지 않고, 측정 가능한 고객 신호를 창출할 수 있을 것으로 점점 더 기대되고 있습니다. France Pub의 보고서에 따르면, 2025년 프랑스 광고 시장은 위축되었으나, 이벤트 및 체험형 마케팅은 다른 커뮤니케이션 부문보다 양호한 실적을 보였으며, 이는 측정 가능한 오프라인 매장 내 고객 참여를 위해 예산을 재분배하는 것이 타당함을 뒷받침하고 있습니다. GDPR(EU 개인정보보호규정) 및 각국의 관련 개인정보 보호 규정에 따라, 유럽은 여전히 활성화 과정에서 데이터 수집과 관련하여 규정 준수 요건이 가장 엄격한 지역이며, 이로 인해 운영 비용은 증가하지만, 거버넌스 체제가 잘 갖춰진 제공업체에게는 유리하게 작용하고 있습니다.
아시아태평양은 수익형 마케팅 서비스 시장에서 가장 빠르게 성장하고 있는 지역으로, 2026-2031년 연평균 성장률(CAGR) 14.18%로 성장을 지속할 전망입니다. 중국, 인도, 일본, 한국, 호주는 각각 서로 다른 활성화 모델을 채택하고 있어, 통신사는 이 지역을 단일 사업 환경으로 취급할 수 없습니다. 인도에서는 조직화된 소매업의 확대와 헬스케어 관련 분야 수요로 인해 서비스 수요가 지역 평균을 웃도는 속도로 증가하고 있습니다. 한편, 일본에서는 성장이 둔화되고 있는 부문에서 브랜드들이 주목을 받기 위해 경쟁하는 가운데, 매장 내 프리미엄 경험에 대한 체계적인 투자가 증가하고 있습니다. 호주 개인정보 보호 규제 당국(OAIC)은 조직의 개인 데이터 관리 방식에 초점을 맞춘 2026년 규정 준수 일제 조사를 시작했는데, 이는 대면으로 소비자 정보를 수집하는 현장 조사 및 표본 조사 프로그램과 직접적인 관련이 있습니다. 남미에서는 브라질, 멕시코와 무역 면에서 긴밀한 관계를 맺고 있는 브랜드 네트워크가 칠레와 콜롬비아에서 강력한 성장세를 보이고 있습니다. 중동에서는 B2B 행사 인프라 구축과 체험형 소매업에 대한 투자가 호재로 작용하고 있습니다. 한편, 아프리카는 여전히 규모가 가장 작은 지역 클러스터이지만, FMCG(일용소비재) 샘플링, 통신 분야의 현장 영업, 금융 서비스의 리드 생성 분야에서 남아프리카공화국, 이집트, 나이지리아가 주도적인 역할을 하고 있습니다.
기타 혜택 :
- 엑셀 형식 시장 예측(ME) 시트
- 3개월간의 애널리스트 지원
자주 묻는 질문
목차
제1장 서론
제2장 조사 방법
제3장 주요 요약
제4장 시장 구도
제5장 시장 규모 및 성장 예측
제6장 경쟁 구도
제7장 시장 기회 및 향후 전망
AJY 26.07.03According to Mordor Intelligence, the revenue marketing services market size is projected to expand from USD 31.1 billion in 2025 and USD 34.15 billion in 2026 to USD 54.8 billion by 2031, registering a CAGR of 9.90% between 2026 to 2031.
This report is Segmented by Service Type (Strategy and Program Design, Field Execution and Staffing, and More), End-User Industry (Retail and E-Commerce, Consumer Goods and Beauty, and More), Engagement Mode (In-Person Programs, Hybrid Programs, and More), Campaign Objective (Customer Acquisition, Lead Generation, and More), and Geography. The Market Forecasts are Provided in Terms of Value (USD).
Global Revenue Marketing Services Market Trends and Insights
Rising Demand for Measurable Experiential ROI
The revenue marketing services market is seeing stronger demand for measurable event and field outcomes because finance teams no longer treat live activation as spend that sits outside revenue scrutiny. Event teams have become better at linking attendance behavior to CRM and pipeline reporting, and 40% of organizers still reported difficulty proving ROI in 2026, down from 70% in 2025. That improvement matters because it shows that methodology, not just spend levels, is changing buyer confidence in the revenue marketing services market. Smaller and mid-sized brands are also under tighter budget review, which makes unified reporting and defensible attribution more important when contracts come up for renewal. Providers that can show how event engagement connects to pipeline movement or retention are moving into a stronger position in the revenue marketing services market. Providers that still rely on isolated event dashboards or manual recap files are facing higher renewal risk even when execution quality remains solid.
Expansion of Omnichannel and Face-to-Face Channel Mix
The revenue marketing services market is no longer shaped by a simple tradeoff between digital and physical budgets, because many clients now fund both at the same time for different roles in the same program. Physical activations are increasingly expected to generate digital signals, while digital channels are being used to extend follow-up, retargeting, and measurement around live programs. This is changing the operating model of the revenue marketing services market, because field teams are now expected to support QR redemption, consent capture, and real-time follow-up tasks during the activation itself. France Pub reported that the French advertising market contracted in 2025, yet events and experiential outperformed other offline categories, which supports the view that brands are moving spend toward more measurable physical engagement rather than abandoning it. As a result, service providers are being asked to train staff for blended physical and digital workflows instead of traditional event-only execution. This shift is helping the revenue marketing services market grow in areas where face-to-face contact remains essential but where clients still want the reach and data discipline of digital programs.
Budget Scrutiny and Longer Revenue Proof Windows
Budget review is becoming a larger brake on the revenue marketing services market because physical programs often need more time than digital media to show final sales or conversion results. Marketing teams are operating under tighter internal review, and the CMO Survey reported that training budgets fell to 3.8% of marketing spend while headcount growth slowed sharply year over year in 2026. That environment is leading to slower procurement cycles, more pilot requirements, and more mid-program performance reviews across the revenue marketing services market. The problem is structural, because retail sell-through, repeat purchase, and CRM conversion often need 60-90 days to become visible after a live program ends. That timing can clash with approval cycles that now demand faster proof and more finance-ready documentation. Providers that can break work into milestones and report progress in a format that finance teams accept are better placed to defend budgets in the revenue marketing services market.
Other drivers and restraints analyzed in the detailed report include:
- Growing Use of Product Demonstration and Sampling to Lift Conversion
- First-Party and Zero-Party Data Capture Through Live Activations
- Shortage of Trained Field and Event Labor
For complete list of drivers and restraints, kindly check the Table Of Contents.
Segment Analysis
Field Execution and Staffing held 27.74% of the revenue marketing services market share in 2025, which reflects its role as the operating base for almost every downstream service category. The segment remains central because product demos, roadshows, in-store activations, and sales support all depend on trained personnel being deployed consistently across locations. In the revenue marketing services market, that leadership also comes with higher exposure to wage pressure, labor platform disruption, and client expectations for digitally verified proof rather than self-reported activity logs. Advantage Solutions reported events growth of nearly 20% in the first quarter of 2026 and an improved execution rate of 94%, which points to the value of centralized labor management and ongoing technology upgrades at scale. Measurement and Analytics is the fastest-growing service type at a 14.26% CAGR from 2026 to 2031, which shows that proof architecture is moving closer to the center of buying criteria.
Strategy and Program Design still command premium pricing in the revenue marketing services industry, but it remains lower in volume because it is usually purchased with execution rather than on a standalone basis. Retail Merchandising and In-Store Activation continues to benefit from retailer-brand accountability agreements that require tighter compliance at the shelf and stronger store-level reporting. Event and Roadshow Management, Lead Generation and Sales Support, and Product Demonstration and Sampling remain attractive parts of the revenue marketing services market, but these areas are fragmented and increasingly judged on their ability to connect execution with measurement. That is why providers that can bundle labor, workflow systems, analytics, and client reporting are gaining a more durable pricing edge than vendors that sell execution only.
Within the revenue marketing services market size in 2025, Retail and E-commerce accounted for a 30.16% share, which reflects the continued fight for shelf visibility, point-of-sale conversion, and trade partner support. This lead is tied to intense retail competition, where brands still need people in stores and on the ground to influence assortment, compliance, and shopper decision-making. Consumer Goods and Beauty followed closely in importance, because sampling and demonstration remain central to launch support and repeat purchase strategies in categories with high trial sensitivity. IT, Telecom, and BFSI use the revenue marketing services market in a different way, with more emphasis on B2B events, roadshows, lead generation, and pipeline progression. Healthcare and Life Sciences is the fastest-growing end-user category at a 15.44% CAGR from 2026 to 2031, which shows how quickly compliant omnichannel engagement is becoming a priority after years of reduced access to healthcare professionals.
Real Chemistry reported USD 560 million in 2025 revenue and 14% growth over 2024, and it said momentum is expected to strengthen in 2026 through AI-enabled delivery and expanded precision media services. That example matters because specialist healthcare providers can absorb regulatory complexity that generalist firms often struggle to manage in the revenue marketing services market. HIPAA, GxP standards, and category-specific marketing rules raise the compliance burden, but they also create a barrier to entry that can support stronger margins for capable firms in the revenue marketing services industry. Media and Entertainment, Education, Travel and Hospitality, Industrial, and Automotive also remain active users of revenue marketing services, though their activation calendars, measurement frameworks, and buyer priorities differ by category.
Complete Report Scope:
- By Service Type
- Strategy and Program Design
- Field Execution and Staffing
- Retail Merchandising and In-Store Activation
- Product Demonstration and Sampling
- Event and Roadshow Management
- Lead Generation and Sales Support
- Measurement and Analytics
- Other Service Types
- By End-user Industry
- Retail and E-commerce
- Consumer Goods and Beauty
- Media and Entertainment
- IT and Telecom
- BFSI
- Healthcare and Life Sciences
- Other End-user Industries (Education, Travel and Hospitality, Industrial, Automotive)
- By Engagement Mode
- In-Person Programs
- Hybrid Programs
- Digitally Amplified Field Programs
- By Campaign Objective
- Customer Acquisition
- Lead Generation
- Sales Conversion
- Product Trial and Sampling
- Brand Awareness and Engagement
- Channel and Retail Partner Support
- Other Campaign Objectives
- By Geography
- North America
- United States
- Canada
- Mexico
- South America
- Brazil
- Argentina
- Chile
- Rest of South America
- Europe
- Germany
- United Kingdom
- France
- Italy
- Spain
- Rest of Europe
- Asia-Pacific
- China
- Japan
- India
- South Korea
- Australia
- Rest of Asia-Pacific
- Middle East
- United Arab Emirates
- Saudi Arabia
- Qatar
- Rest of Middle East
- Africa
- South Africa
- Egypt
- Nigeria
- Rest of Africa
- North America
Geography Analysis
North America commanded 46.30% of the revenue marketing services market share in 2025, which keeps the region in the leading position globally. The United States accounts for the largest part of regional demand, supported by a mature outsourced field marketing structure, deep retail-brand co-investment models, and heavy B2B event activity. Canada adds similar demand patterns at a smaller scale, while Mexico continues to develop as organized retail expands and multinational consumer brands increase field execution investment. In the revenue marketing services market, North America is also where budget scrutiny is most visible, because marketing teams are operating under tighter headcount and spend controls. Privacy compliance is also becoming more material in the region, which is raising the cost and complexity of data handling for live programs.
Europe remained the second-largest regional block in the revenue marketing services market, supported by established B2B event infrastructure in Germany and the United Kingdom and strong experiential demand from FMCG and beauty brands in France and Italy. The region also benefits from a broad base of omnichannel activation demand, where physical engagement is increasingly expected to generate measurable customer signals rather than brand exposure alone. France Pub reported that the French advertising market declined in 2025, yet events and experiential performed better than other communication categories, which supports the case for budget redistribution toward measurable physical engagement. GDPR and related national privacy rules continue to make Europe the most compliance-intensive region for data capture at activations, which raises operating overhead but also favors providers with stronger governance processes.
Asia-Pacific is the fastest-growing region in the revenue marketing services market, with a 14.18% CAGR from 2026 to 2031. China, India, Japan, South Korea, and Australia each represent different activation models, which means providers cannot treat the region as a single operating environment. India's organized retail expansion and healthcare-related field demand are lifting service needs faster than the regional average, while Japan is seeing more structured investment in premium in-store experience as brands compete for attention in slower-growth categories. Australia's privacy regulator launched a 2026 compliance sweep that focused on how organizations manage personal data, which is directly relevant for field and sampling programs that gather consumer information in person OAIC. South America is seeing stronger growth in Brazil, Mexico's neighboring trade-linked brand networks, Chile, and Colombia, the Middle East is gaining from B2B event infrastructure and experiential retail investment, and Africa remains the smallest regional cluster, led by South Africa, Egypt, and Nigeria for FMCG sampling, telecom field sales, and financial services lead generation.
- Advantage Solutions Inc.
- Acosta Group
- The Freeman Company
- Informa PLC
- Pico Far East Holdings Limited
- Omnicom Group Inc.
- George P. Johnson Company
- Publicis Groupe S.A.
- dentsu Group Inc.
- WPP plc
- Stagwell Inc.
- BCD Meetings and Events
- INVNT Group
- Clarion Events Limited
- DMG EVENTS (UK) LIMITED
- Jack Morton Worldwide, Inc.
- The George P. Johnson Company
- Momentum Worldwide
- Elevate Global Limited
- Cvent Holding Corp.
Additional Benefits:
- The market estimate (ME) sheet in Excel format
- 3 months of analyst support
TABLE OF CONTENTS
1 INTRODUCTION
- 1.1 Study Assumptions and Market Definition
- 1.2 Scope of the Study
2 RESEARCH METHODOLOGY
3 EXECUTIVE SUMMARY
4 MARKET LANDSCAPE
- 4.1 Market Overview
- 4.2 Market Drivers
- 4.2.1 Rising Demand for Measurable Experiential ROI
- 4.2.2 Expansion of Omnichannel and Face-to-Face Channel Mix
- 4.2.3 Growing Use of Product Demonstration and Sampling to Lift Conversion
- 4.2.4 Retailer Demand for High-Accountability In-Store Execution
- 4.2.5 First-Party and Zero-Party Data Capture Through Live Activations
- 4.2.6 ABM and Field Marketing Convergence in B2B Revenue Teams
- 4.3 Market Restraints
- 4.3.1 Budget Scrutiny and Longer Revenue Proof Windows
- 4.3.2 Shortage of Trained Field and Event Labor
- 4.3.3 CRM and Event-Tech Fragmentation Weakening Closed-Loop Attribution
- 4.3.4 Permit, Privacy, and Category Compliance Complexity in Roadshows and Sampling
- 4.4 Impact of Macroeconomic Factors on the Market
- 4.5 Industry Value Chain Analysis
- 4.6 Regulatory Landscape
- 4.7 Technological Outlook
- 4.8 Porter's Five Forces Analysis
- 4.8.1 Threat of New Entrants
- 4.8.2 Bargaining Power of Buyers
- 4.8.3 Bargaining Power of Suppliers
- 4.8.4 Threat of Substitutes
- 4.8.5 Competitive Rivalry
5 MARKET SIZE AND GROWTH FORECASTS (VALUE)
- 5.1 By Service Type
- 5.1.1 Strategy and Program Design
- 5.1.2 Field Execution and Staffing
- 5.1.3 Retail Merchandising and In-Store Activation
- 5.1.4 Product Demonstration and Sampling
- 5.1.5 Event and Roadshow Management
- 5.1.6 Lead Generation and Sales Support
- 5.1.7 Measurement and Analytics
- 5.1.8 Other Service Types
- 5.2 By End-user Industry
- 5.2.1 Retail and E-commerce
- 5.2.2 Consumer Goods and Beauty
- 5.2.3 Media and Entertainment
- 5.2.4 IT and Telecom
- 5.2.5 BFSI
- 5.2.6 Healthcare and Life Sciences
- 5.2.7 Other End-user Industries (Education, Travel and Hospitality, Industrial, Automotive)
- 5.3 By Engagement Mode
- 5.3.1 In-Person Programs
- 5.3.2 Hybrid Programs
- 5.3.3 Digitally Amplified Field Programs
- 5.4 By Campaign Objective
- 5.4.1 Customer Acquisition
- 5.4.2 Lead Generation
- 5.4.3 Sales Conversion
- 5.4.4 Product Trial and Sampling
- 5.4.5 Brand Awareness and Engagement
- 5.4.6 Channel and Retail Partner Support
- 5.4.7 Other Campaign Objectives
- 5.5 By Geography
- 5.5.1 North America
- 5.5.1.1 United States
- 5.5.1.2 Canada
- 5.5.1.3 Mexico
- 5.5.2 South America
- 5.5.2.1 Brazil
- 5.5.2.2 Argentina
- 5.5.2.3 Chile
- 5.5.2.4 Rest of South America
- 5.5.3 Europe
- 5.5.3.1 Germany
- 5.5.3.2 United Kingdom
- 5.5.3.3 France
- 5.5.3.4 Italy
- 5.5.3.5 Spain
- 5.5.3.6 Rest of Europe
- 5.5.4 Asia-Pacific
- 5.5.4.1 China
- 5.5.4.2 Japan
- 5.5.4.3 India
- 5.5.4.4 South Korea
- 5.5.4.5 Australia
- 5.5.4.6 Rest of Asia-Pacific
- 5.5.5 Middle East
- 5.5.5.1 United Arab Emirates
- 5.5.5.2 Saudi Arabia
- 5.5.5.3 Qatar
- 5.5.5.4 Rest of Middle East
- 5.5.6 Africa
- 5.5.6.1 South Africa
- 5.5.6.2 Egypt
- 5.5.6.3 Nigeria
- 5.5.6.4 Rest of Africa
- 5.5.1 North America
6 COMPETITIVE LANDSCAPE
- 6.1 Market Concentration
- 6.2 Strategic Moves
- 6.3 Market Share Analysis
- 6.4 Company Profiles (includes Global Level Overview, Market Level Overview, Core Segments, Financials as available, Strategic Information, Market Rank/Share, Products and Services, Recent Developments)
- 6.4.1 Advantage Solutions Inc.
- 6.4.2 Acosta Group
- 6.4.3 The Freeman Company
- 6.4.4 Informa PLC
- 6.4.5 Pico Far East Holdings Limited
- 6.4.6 Omnicom Group Inc.
- 6.4.7 George P. Johnson Company
- 6.4.8 Publicis Groupe S.A.
- 6.4.9 dentsu Group Inc.
- 6.4.10 WPP plc
- 6.4.11 Stagwell Inc.
- 6.4.12 BCD Meetings and Events
- 6.4.13 INVNT Group
- 6.4.14 Clarion Events Limited
- 6.4.15 DMG EVENTS (UK) LIMITED
- 6.4.16 Jack Morton Worldwide, Inc.
- 6.4.17 The George P. Johnson Company
- 6.4.18 Momentum Worldwide
- 6.4.19 Elevate Global Limited
- 6.4.20 Cvent Holding Corp.
7 MARKET OPPORTUNITIES AND FUTURE OUTLOOK
- 7.1 White-space and Unmet-Need Assessment

