

|
시장보고서
상품코드
2118038
인터랙티브 OTT 광고 시장 : 점유율 분석, 업계 동향과 통계, 성장 예측(2026-2031년)Interactive OTT Advertising - Market Share Analysis, Industry Trends & Statistics, Growth Forecasts (2026 - 2031) |
||||||
 Mordor Intelligence
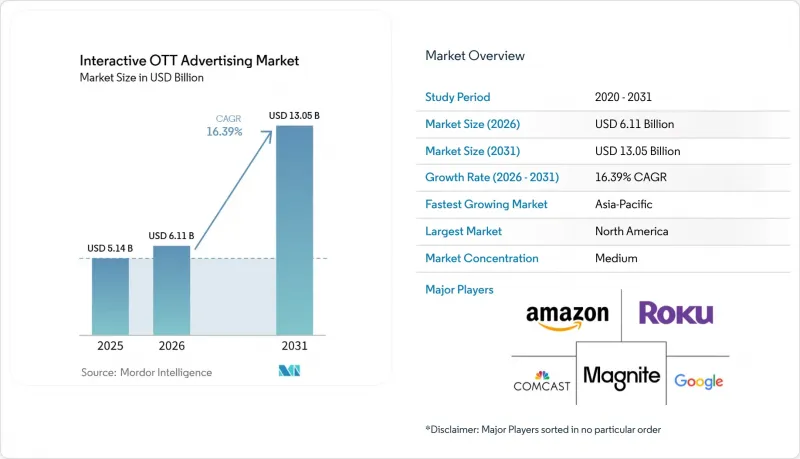
Mordor Intelligence에 의하면, 인터랙티브 OTT 광고 시장 규모는 2025년에 51억 4,000만 달러로 평가되었고 2026년부터 2031년까지 CAGR 16.39%로 확대되어 2031년에는 130억 5,000만 달러에 이를 것으로 예측됩니다.
본 보고서는 기기 유형(스마트 TV, 스마트폰 및 태블릿, 게임기, 노트북 및 데스크톱 PC, 기타), 최종 사용자(미디어 및 엔터테인먼트, 소매 및 전자상거래,자동차, 은행, 금융서비스 및 보험(BFSI), 헬스케어, 여행 및 호스피탈리티, 기타) 및 지역(북미, 남미, 유럽, 아시아태평양, 중동 및 아프리카)별로 분류되어 있습니다. 시장 예측은 금액(달러) 기준으로 제시되어 있습니다.
세계 인터랙티브 OTT 광고 시장 동향 및 인사이트
CTV 및 광고 지원형 OTT로의 시청 시간 이동
인터랙티브 OTT 광고 시장의 배후에 있는 가장 큰 구조적 요인은 시청 시간이 기존 TV에서 커넥티드 스트리밍 플랫폼으로 지속적으로 이동하고 있다는 점입니다. IAB에 따르면, 2026년에는 CTV의 광고 지출이 13.8% 증가할 것으로 예상되며, 이에 따라 스트리밍은 전체 광고 시장을 계속 주도하게 되고, 인터랙티브 형식의 광고 슬롯 기반이 확대될 것입니다. 이러한 변화가 중요한 이유는 인터랙티브 OTT 광고 시장이 소비자가 화면에 충분한 시간을 머물며 프롬프트를 인식하거나, 코드를 스캔하거나, 오버레이에 응답할 수 있는 환경에 의존하기 때문입니다. 광고 수익형 요금제가 확대됨에 따라, 강력한 ID 관리 시스템을 갖춘 프리미엄 퍼블리셔는 가격 결정력과 구매자의 신뢰를 확보하는 데 유리한 입장에 있습니다. 그 결과, 시장은 스트리밍 이용자가 증가하고 있을 뿐만 아니라, 해당 스트리밍의 상당 부분이 상업적으로 타겟팅 가능해짐에 따라 성장하고 있습니다. 이러한 추세로 인해 인터랙티브 OTT 광고 시장은 현재 전 세계 동영상 수익화 방식을 변화시키고 있는 보다 광범위한 스트리밍으로의 전환과 밀접하게 연결되어 있습니다.
소매 미디어 데이터가 OTT 광고 구매에 파급 효과
리테일 미디어 데이터는 인터랙티브 OTT 광고 시장을 형성하는 가장 명확한 수요 신호 중 하나가 되었습니다. NBC 유니버설의 보고서에 따르면, 리테일 미디어 CTV 광고비 증가율은 리테일 미디어 검색 광고의 3배에 달하며, 이는 커머스 데이터가 얼마나 빠르게 스트리밍 광고 활용으로 전환되고 있는지를 보여줍니다. 이러한 변화로 인해 광고주는 더 큰 확신을 얻을 수 있습니다. 기존 TV 광고 기획에 비해 추측의 여지가 적고, 노출을 온라인 및 매장 내 행동과 연결할 수 있기 때문입니다. 또한, 이러한 변화는 이 채널에 투자하는 주체에도 변화를 가져오고 있습니다. 소매업 이외의 부문도 동일한 폐쇄 루프 논리를 채택함으로써, 보다 명확한 성과를 바탕으로 동영상 광고 예산을 정당화할 수 있게 되었기 때문입니다. 이로 인해 과거 스트리밍을 주로 인지도 제고 수단으로만 여겼던 성과 중심의 구매자들에게 인터랙티브 OTT 광고 시장은 더욱 매력적인 선택지가 되고 있습니다. 이 모델이 널리 보급될수록, 인터랙티브 OTT 광고 시장은 소매 미디어를 광고 우선순위 목록의 최상위로 끌어올렸던 것과 동일한 설명 책임 기준의 혜택을 점점 더 많이 누리게 될 것입니다.
분산된 크로스 플랫폼 측정 기준
측정의 파편화는 인터랙티브 OTT 광고 시장에 있어 여전히 가장 큰 장벽 중 하나입니다. 이는 어트리뷰션의 일관성보다는 광고 구매의 고도화가 더 빠르게 진행되고 있기 때문입니다. 업계 합동 위원회(Joint Industry Committee)는 2025-2026년 트랜잭터빌리티 관련 노력을 통해, 새로운 광고 통화 간에도 조사 방법론에 여전히 차이가 있으며, 맞춤형 데이터가 없이는 통일된 크로스 플랫폼 보고가 어렵다는 점을 확인했습니다. 또한 IAB 보고서에 따르면, 퍼블리셔의 72%가 표준화된 CTV 전환 API 도입의 장벽으로 기술적 복잡성을 꼽았습니다. 이는 광고주에게 실질적인 문제가 됩니다. 플랫폼별 보고서에서는 개별 도달률이 과대평가되거나 크로스 플랫폼 중복이 숨겨질 가능성이 있기 때문입니다. 이러한 부담을 가장 크게 떠안고 있는 것은 독자적인 측정 시스템을 구축할 기술 자원이 없는 중규모 구매자입니다. 이 상황이 개선될 때까지 인터랙티브 OTT 광고 시장은 보다 성숙한 디지털 채널에서는 구매자가 그다지 직면하지 않는 보고상의 미비로 인해 예산 효율성의 일부를 계속해서 잃게 될 것입니다.
부문 분석
2025년, 인터랙티브 OTT 광고 시장의 48.23%를 스마트 TV가 차지하며 다른 기기 환경을 크게 앞섰습니다. 이러한 우위는 대형 화면에서 편안하게 시청하는 환경이 사용자에게 시청 경험을 즉시 중단시키지 않으면서, 광고주가 인터랙티브 프롬프트를 표시할 수 있는 시간을 더 많이 제공한다는 사실을 반영합니다. 일본에서는 기기의 보급이 상업용 광고 슬롯으로 어떻게 연결되는지를 보여주는 좋은 사례를 볼 수 있습니다. 일본의 CTV 부문은 2025년에 1,295억 엔(8억 6,400만 달러)에 달하며 전년 대비 127%의 성장을 기록했습니다. 스마트 TV의 이용은 ‘쇼핑이 가능한 시청 경험’으로의 전환과도 부합합니다. TV 화면이 시청자의 주의를 끌고, 동반 기기가 최종 결제 처리를 수행하기 때문입니다. 따라서 광고주들이 새로운 환경을 시험적으로 도입하고 있는 와중에도, 스마트 TV는 여전히 인터랙티브 OTT 광고 시장의 기반이 되는 기기로 남아 있습니다.
스마트폰 및 태블릿은 인터랙티브 OTT 광고 시장에서 여전히 중요한 역할을 하고 있지만, 대부분의 경우 TV 화면에서 시작된 QR 코드 스캔, 장바구니 추가 또는 결제와 같은 행동을 완료하기 위한 보조 도구로 기능하고 있습니다. 또한, 노트북과 데스크톱 PC도 인터랙티브 OTT 광고 시장에서 여전히 중요한 위치를 차지하고 있으며, 광고주는 컨텍스트 기반 조사, 재택근무 중 스트리밍, 혹은 B2B형 시청자 행동과의 보다 강력한 연관성을 추구하고 있습니다. 게임기는 2031년까지 연평균 성장률(CAGR) 17.51%로 확대될 것으로 예측되며, 인터랙티브 OTT 광고 시장에서 가장 두드러진 성장을 보일 기기 카테고리가 될 전망입니다. Microsoft Advertising은 인용된 조사에서 게임 광고의 완전 시청률이 100%였던 반면, 온라인 동영상은 86%, 소셜 미디어는 77%에 그쳤다고 밝혔으며, 이는 광고 공간을 효과적으로 활용할 수 있는 광고주에게 주목할 만한 환경임을 시사합니다. 동 출처는 또한 전 세계 게임 사용자층의 규모와 사용자의 관심도, 광고 투자액 간의 격차에 대해서도 언급하며, 이것이 콘솔 광고 공간이 보다 표준화된 수익화 노력을 이끌어내기 시작한 이유를 설명하고 있습니다. 콘솔 내 및 게임 내 광고 형식의 거래가 용이해짐에 따라, 인터랙티브 OTT 광고 시장에서 콘솔이 예산의 더 큰 비중을 차지할 가능성이 높습니다. 이러한 성장은 단기적으로는 스마트 TV를 대체하지는 않겠지만, 인터랙티브 광고가 효과를 발휘할 수 있는 프리미엄 스크린의 범위를 확대하게 될 것입니다.
지역별 분석
아시아태평양은 2031년까지 연평균 성장률(CAGR) 17.24%로 확대될 것으로 예측되며, 인터랙티브 OTT 광고 시장에서 가장 두드러진 성장을 보일 것으로 전망됩니다. 일본의 동영상 광고 시장 규모는 2025년에 8,855억 엔(59억 달러)에 달하고, 2026년에는 1조 1,783억 엔(79억 달러)에 이를 것으로 예측되어, 스트리밍 수익화를 위한 지역적으로 견고한 기반을 시사하고 있습니다. 이러한 지역적 추세는 AVIA의 보고서에서도 뒷받침되고 있습니다. 해당 기관은 아시아태평양의 스크린 산업 수익이 2025년부터 2030년까지 연평균 성장률(CAGR) 2.8%로 확대될 것으로 예측하며, 그 순증분은 전적으로 온라인 채널에 기인할 것이라고 밝혔습니다. 온라인 주도의 스크린 시장 성장은 아시아의 선진국과 개발도상국 모두에서 인터랙티브 OTT 광고 시장에 더 광범위한 공급 기반을 제공한다는 점에서 중요합니다. 또한 이는 아시아태평양이 인터랙티브 OTT 광고 시장에서 신흥 기회에서 핵심 성장 동력으로 전환되고 있다는 견해를 뒷받침합니다.
2025년 시점에서 북미는 인터랙티브 OTT 광고 시장 점유율의 43.58%를 차지하며, 가장 규모가 큰 지역 시장이 될 전망입니다. 이 지역은 성숙한 프로그래매틱 생태계, 높은 커넥티드 TV 보급률, 그리고 전체 스트리밍 광고 슬롯에서 시청자 참여를 촉진하는 강력한 리테일 미디어 인프라의 혜택을 받고 있습니다. Amazon Ads와 Roku는 2025년, 양사의 제휴를 통해 미국에서 최대 규모의 인증된 CTV 네트워크가 구축되었다고 발표했습니다. 초기 테스트 결과, 동일한 예산으로 고유 시청자 수가 40% 증가했으며, 광고 노출 빈도는 30% 가까이 감소한 것으로 나타났습니다. 또한, 캐나다도 품질을 중시하는 광고 구매처로서 주목받고 있으며, Pixalate의 2025년 4분기 북미 벤치마크에 따르면 CTV 공급에서 무효 트래픽의 비율이 미국보다 낮은 것으로 나타났습니다.
유럽은 인터랙티브 OTT 광고 시장에서 중요한 위치를 차지하고 있으며, 영국과 독일이 주요 성장 거점으로 부상하고 있습니다. Pixalate의 보고서에 따르면, 2026년 1분기 영국의 CTV에서 무효 트래픽 비율은 46.1%, 독일에서는 44%에 달했으며, 이는 이 지역의 대규모 시장 일부에서 부정 행위의 압박이 실효 수익에 어떤 영향을 미치고 있는지를 보여줍니다. 이러한 상황으로 인해 구매자들은 가장 광범위한 오픈 마켓 경로가 아닌, 프리미엄 직접 거래나 엄선된 공급 경로로 전환하고 있습니다. 프랑스, 이탈리아, 스페인 및 기타 유럽 국가들은 지역 프로그램 기반 OTT 인프라를 지속적으로 강화하고 있는 반면, 남미에서는 스트리밍 진입 장벽이 낮아 시청자들이 기존 유료 TV에서 쉽게 전환할 수 있는 이점을 누리고 있습니다. 두 지역 모두에서 디지털 동영상 소비가 기존 시청 모델의 적응 속도를 앞지르는 속도로 증가하고 있는 분야에서는 인터랙티브 OTT 광고 시장이 탄력을 받고 있습니다.
기타 혜택:
- 엑셀 형식 시장 예측(ME) 시트
- 3개월간의 애널리스트 지원
자주 묻는 질문
목차
제1장 서론
제2장 조사 방법
제3장 개요
제4장 시장 구도
제5장 시장 규모와 성장 예측
제6장 경쟁 구도
제7장 시장 기회와 향후 전망
JHS 26.09.01According to Mordor Intelligence, the interactive OTT advertising market size was valued at USD 5.14 billion in 2025 and is forecast to reach USD 13.05 billion by 2031 at a CAGR of 16.39% from 2026 to 2031.
This report is Segmented by Device Type (Smart TVs, Smartphones and Tablets, Gaming Consoles, Laptops and Desktops, and More), End-User (Media and Entertainment, Retail and E-Commerce, Automotive, BFSI, Healthcare, Travel and Hospitality, and More), and Geography (North America, South America, Europe, Asia-Pacific, Middle East, and Africa). The Market Forecasts are Provided in Terms of Value (USD).
Global Interactive OTT Advertising Market Trends and Insights
Streaming Time Shift Toward CTV And Ad-Supported OTT
The largest structural force behind the interactive OTT advertising market is the continued shift in viewing time from linear television to connected streaming platforms. The IAB stated that CTV ad spend is expected to grow 13.8% in 2026, keeping streaming ahead of the broader advertising environment and expanding the inventory base for interactive formats. That change matters because the interactive OTT advertising market depends on environments where consumers stay on-screen long enough to notice prompts, scan codes, or respond to overlays. As more ad-supported plans gain scale, premium publishers with strong identity systems are better positioned to capture pricing power and buyer confidence. The result is a market that is growing not only because more people are streaming, but also because more of that streaming is becoming commercially addressable. This dynamic keeps the interactive OTT advertising market closely tied to the broader streaming migration, now reshaping video monetization worldwide.
Retail Media Data Spillover into OTT Buying
Retail media data has become one of the clearest demand signals shaping the interactive OTT advertising market. NBCUniversal reported that retail media CTV ad spend is growing 3x faster than retail media search, which shows how quickly commerce data is moving into streaming activation. That change gives advertisers more confidence because exposure can be linked to online and in-store behavior with less guesswork than in traditional television planning. It also changes who spends in the channel, as sectors outside retail can adopt the same closed-loop logic to justify video budgets with clearer outcomes. This makes the interactive OTT advertising market more attractive to performance-minded buyers who once treated streaming mainly as an awareness vehicle. The longer this model spreads, the more the interactive OTT advertising market benefits from the same accountability standards that propelled retail media to the top of the advertising priority list.
Fragmented Cross-Platform Measurement Standards
Measurement fragmentation remains one of the largest barriers to the interactive OTT advertising market because buying sophistication is improving faster than attribution consistency. The Joint Industry Committee confirmed, through its 2025-2026 transactability work, that methodologies across newer currencies still vary, making unified cross-platform reporting difficult without custom data arrangements. The IAB also reported that 72% of publishers cited technical complexity as a barrier to implementing standardized CTV conversion APIs. This creates a practical problem for advertisers, because platform-native reporting can overstate individual reach and hide cross-platform duplication. The burden falls hardest on mid-sized buyers that do not have the engineering resources to stitch together bespoke measurement systems. Until this improves, the interactive OTT advertising market will continue to lose some budget efficiency to reporting gaps that buyers do not face to the same extent in more mature digital channels.
Other drivers and restraints analyzed in the detailed report include:
- Programmatic Buying Expands Accessible Premium Inventory
- Shoppable And Interactive Creative Improves Conversion Efficiency
- Ad Fraud and Invalid Traffic in Programmatic OTT Supply
For complete list of drivers and restraints, kindly check the Table Of Contents.
Segment Analysis
Smart TVs accounted for 48.23% of the interactive OTT advertising market in 2025, keeping them well ahead of other device environments. Their lead reflects the fact that the large-screen, lean-back setting gives advertisers more time to present interactive prompts without forcing users to leave the viewing experience immediately. Japan offers a useful illustration of how device adoption is translating into commercial inventory, as the country's CTV segment reached JPY 129.5 billion (USD 864 million) in 2025 and grew 127% year over year. Smart TV usage also aligns with the shift toward shoppable viewing, as the television screen can hold attention while companion devices handle the final transaction step. For that reason, smart TVs remain the device foundation of the interactive OTT advertising market even as advertisers test newer environments.
Smartphones and tablets still play an important role in the interactive OTT advertising market, but they often serve as companion tools that complete QR-code, cart, or checkout actions initiated on television screens. Laptops and desktops also retain relevance in the interactive OTT advertising market, where advertisers want a stronger link to contextual research, work-from-home streaming, or B2B-style audience behavior. Gaming consoles are projected to expand at a 17.51% CAGR through 2031, making them the fastest-growing device category in the interactive OTT advertising market. Microsoft Advertising stated that gaming ads were fully viewed 100% of the time in its cited research, compared with 86% for online video and 77% for social media, which points to a strong attention environment for advertisers that can access the supply effectively. The same source also highlighted the scale of global gaming audiences and the gap between user attention and ad investment, which helps explain why console inventory is starting to attract more standardized monetization efforts. As more in-console and in-game formats become easier to transact, consoles are likely to pull a larger share of budgets inside the interactive OTT advertising market. That growth will not displace smart TVs in the near term, but it will expand the range of premium screens where interactive advertising can perform.
Complete Report Scope:
- By Device Type
- Smart TVs
- Smartphones and Tablets
- Gaming Consoles
- Laptops and Desktops
- Other Device Types
- By End-User
- Media and Entertainment
- Retail and E-Commerce
- Automotive
- BFSI
- Healthcare
- Travel and Hospitality
- Other End-Users
- By Geography
- North America
- United States
- Canada
- Mexico
- South America
- Brazil
- Argentina
- Chile
- Rest of South America
- Europe
- Germany
- United Kingdom
- France
- Italy
- Spain
- Rest of Europe
- Asia-Pacific
- China
- Japan
- India
- South Korea
- Australia
- Rest of Asia-Pacific
- Middle East
- Saudi Arabia
- United Arab Emirates
- Qatar
- Rest of Middle East
- Africa
- South Africa
- Egypt
- Nigeria
- Rest of Africa
- North America
Geography Analysis
Asia-Pacific is projected to expand at a 17.24% CAGR through 2031, making it the fastest-growing region in the interactive OTT advertising market. Japan's total video advertising market reached JPY 885.5 billion (USD 5.9 billion) in 2025 and is projected to reach JPY 1,178.3 billion (USD 7.9 billion) in 2026, suggesting a strong regional backdrop for streaming monetization. The same regional direction is reinforced by AVIA, which stated that Asia-Pacific screen industry revenues are projected to grow at a 2.8% CAGR from 2025 to 2030, with all net growth coming from online channels. That matters because online-led screen growth provides the interactive OTT advertising market with a broader supply base across both developed and developing Asian economies. It also supports the view that Asia-Pacific is moving from an emerging opportunity to a core expansion engine for the interactive OTT advertising market.
North America held 43.58% of the interactive OTT advertising market share in 2025, making it the largest regional base. The region benefits from a mature programmatic ecosystem, high connected TV penetration, and a strong retail media infrastructure that improves audience activation across streaming inventory. Amazon Ads and Roku announced in 2025 that their partnership created the largest authenticated CTV footprint in the United States, and early tests showed 40% more unique viewers reached with the same budget and nearly 30% lower ad frequency. Canada has also become attractive for quality-focused buying, with Pixalate's Q4 2025 North America benchmarks showing lower invalid traffic levels than the United States in CTV supply.
Europe holds a meaningful position in the interactive OTT advertising market, with the United Kingdom and Germany serving as the main growth centers. Pixalate reported that UK CTV invalid traffic reached 46.1% and Germany reached 44% in Q1 2026, which shows how fraud pressure is affecting effective yield in some of the region's largest markets. Those conditions are pushing buyers toward premium direct deals and curated supply paths rather than the broadest open-market routes. France, Italy, Spain, and the rest of Europe continue to add depth to the regional programmatic OTT base, while South America is benefiting from lower streaming entry prices that are helping audiences move away from legacy pay TV. Across both regions, the interactive OTT advertising market is gaining ground where digital video consumption is rising faster than legacy viewing models can respond.
- The Trade Desk, Inc.
- Roku, Inc.
- Amazon.com, Inc.
- Google LLC
- Comcast Corporation
- Magnite, Inc.
- Innovid Corp.
- PubMatic, Inc.
- Viant Technology Inc.
- Nexxen International Ltd.
- Samsung Electronics Co., Ltd.
- LG Electronics Inc.
- Fox Corporation
- Paramount Global
- The Walt Disney Company
- Netflix, Inc.
- Warner Bros. Discovery, Inc.
- Teads S.A.
- BrightLine, Inc.
Additional Benefits:
- The market estimate (ME) sheet in Excel format
- 3 months of analyst support
TABLE OF CONTENTS
1 INTRODUCTION
- 1.1 Study Assumptions and Market Definition
- 1.2 Scope of The Study
2 RESEARCH METHODOLOGY
3 EXECUTIVE SUMMARY
4 MARKET LANDSCAPE
- 4.1 Market Overview
- 4.2 Market Drivers
- 4.2.1 Streaming Time Shift Toward CTV and Ad-Supported OTT
- 4.2.2 Retail Media Data Spillover Into OTT Buying
- 4.2.3 Programmatic Buying Expands Accessible Premium Inventory
- 4.2.4 Shoppable and Interactive Creative Improves Conversion Efficiency
- 4.2.5 AI-Driven Contextual Targeting Reduces Third-Party Data Dependence
- 4.2.6 Live Sports and Event Streaming Deepen Attention Windows
- 4.3 Market Restraints
- 4.3.1 Fragmented Cross-Platform Measurement Standards
- 4.3.2 Ad Fraud and Invalid Traffic in Programmatic OTT Supply
- 4.3.3 Privacy Regulation Limits Audience Granularity
- 4.3.4 Premium Content and Licensing Cost Inflation
- 4.4 Industry Value Chain Analysis
- 4.5 Regulatory Landscape
- 4.6 Technological Outlook
- 4.7 Porter's Five Forces Analysis
- 4.7.1 Bargaining Power of Buyers
- 4.7.2 Bargaining Power of Suppliers
- 4.7.3 Threat of New Entrants
- 4.7.4 Threat of Substitutes
- 4.7.5 Intensity of Competitive Rivalry
- 4.8 Impact of Macroeconomic Factors on the Market
5 MARKET SIZE AND GROWTH FORECASTS (VALUE)
- 5.1 By Device Type
- 5.1.1 Smart TVs
- 5.1.2 Smartphones and Tablets
- 5.1.3 Gaming Consoles
- 5.1.4 Laptops and Desktops
- 5.1.5 Other Device Types
- 5.2 By End-User
- 5.2.1 Media and Entertainment
- 5.2.2 Retail and E-Commerce
- 5.2.3 Automotive
- 5.2.4 BFSI
- 5.2.5 Healthcare
- 5.2.6 Travel and Hospitality
- 5.2.7 Other End-Users
- 5.3 By Geography
- 5.3.1 North America
- 5.3.1.1 United States
- 5.3.1.2 Canada
- 5.3.1.3 Mexico
- 5.3.2 South America
- 5.3.2.1 Brazil
- 5.3.2.2 Argentina
- 5.3.2.3 Chile
- 5.3.2.4 Rest of South America
- 5.3.3 Europe
- 5.3.3.1 Germany
- 5.3.3.2 United Kingdom
- 5.3.3.3 France
- 5.3.3.4 Italy
- 5.3.3.5 Spain
- 5.3.3.6 Rest of Europe
- 5.3.4 Asia-Pacific
- 5.3.4.1 China
- 5.3.4.2 Japan
- 5.3.4.3 India
- 5.3.4.4 South Korea
- 5.3.4.5 Australia
- 5.3.4.6 Rest of Asia-Pacific
- 5.3.5 Middle East
- 5.3.5.1 Saudi Arabia
- 5.3.5.2 United Arab Emirates
- 5.3.5.3 Qatar
- 5.3.5.4 Rest of Middle East
- 5.3.6 Africa
- 5.3.6.1 South Africa
- 5.3.6.2 Egypt
- 5.3.6.3 Nigeria
- 5.3.6.4 Rest of Africa
- 5.3.1 North America
6 COMPETITIVE LANDSCAPE
- 6.1 Market Concentration
- 6.2 Strategic Moves
- 6.3 Vendor Positioning Analysis
- 6.4 Company Profiles (includes Global Level Overview, Market Level Overview, Core Segments, Financials as available, Strategic Information, Market Rank/Share, Products and Services, Recent Developments)
- 6.4.1 The Trade Desk, Inc.
- 6.4.2 Roku, Inc.
- 6.4.3 Amazon.com, Inc.
- 6.4.4 Google LLC
- 6.4.5 Comcast Corporation
- 6.4.6 Magnite, Inc.
- 6.4.7 Innovid Corp.
- 6.4.8 PubMatic, Inc.
- 6.4.9 Viant Technology Inc.
- 6.4.10 Nexxen International Ltd.
- 6.4.11 Samsung Electronics Co., Ltd.
- 6.4.12 LG Electronics Inc.
- 6.4.13 Fox Corporation
- 6.4.14 Paramount Global
- 6.4.15 The Walt Disney Company
- 6.4.16 Netflix, Inc.
- 6.4.17 Warner Bros. Discovery, Inc.
- 6.4.18 Teads S.A.
- 6.4.19 BrightLine, Inc.
7 MARKET OPPORTUNITIES AND FUTURE OUTLOOK
- 7.1 White-Space and Unmet-Need Assessment


