

|
시장보고서
상품코드
2119184
아시아태평양의 광고용 주문형 비디오 : 시장 점유율 분석, 업계 동향 및 통계, 성장 예측(2026-2031년)Asia-Pacific Advertising Video-on-Demand - Market Share Analysis, Industry Trends & Statistics, Growth Forecasts (2026 - 2031) |
||||||
 Mordor Intelligence
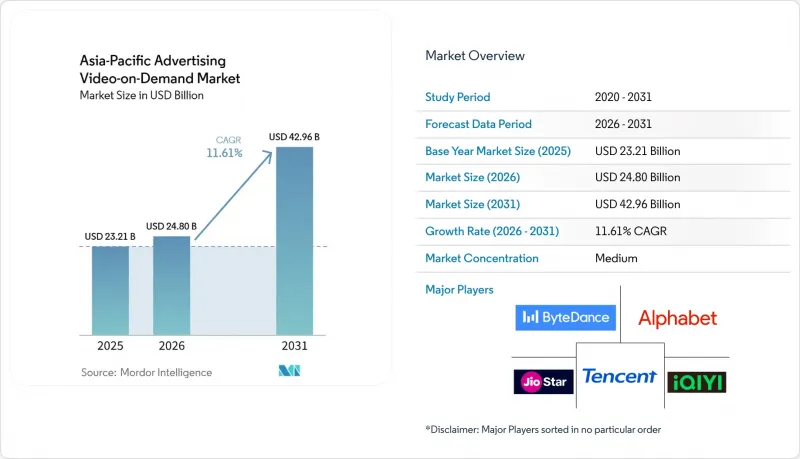
Mordor Intelligence에 의하면, 아시아태평양의 광고용 주문형 비디오 시장 규모는 2025년 232억 1,000만 달러로 평가되었습니다. 2026년에는 248억 달러로 확대되어 2026년부터 2031년에 걸쳐 CAGR 11.61%로 성장을 지속하여, 2031년에는 429억 6,000만 달러에 이를 것으로 예측됩니다.
본 보고서는 콘텐츠 유형(영화, TV 프로그램·시리즈 콘텐츠, 다큐멘터리), 기기 유형(스마트폰·태블릿,스마트 TV, 노트북·데스크톱 PC), 최종 사용자(미디어 및 엔터테인먼트, 소매 및 전자상거래, 교육, 기타), 광고 형식(프리롤, 미드롤, 포스트롤) 및 지역별로 분류되어 있습니다. 시장 예측은 금액(달러) 기준으로 제시되어 있습니다.
아시아태평양의 광고용 주문형 비디오 시장 동향 및 인사이트
커넥티드 TV로의 광고 지출 전환이 진행되고 있습니다.
커넥티드 TV는 더 광범위한 가구 시청층과 고가치 광고 슬롯을 결합하고 있어, 아시아태평양의 광고용 주문형 비디오 시장을 재편하고 있습니다. 스마트 TV는 많은 모바일 광고 슬롯보다 장편 크리에이티브 포맷, 공동 시청, 그리고 프리미엄 브랜드 캠페인에 적합한 환경을 제공합니다. 가정 내 광대역 연결의 보급과 스마트 TV 가격 하락으로 인해 인도, 호주, 일본, 한국에서 커넥티드 TV 시청자층이 확대되고 있습니다. 이에 따라 플랫폼 전략이 단순한 도달 범위 추구를 넘어, 주목도의 질과 노출당 획득 단가로 전환되고 있습니다. 다만, 이러한 움직임에 있어 플랫폼 및 기기 제조업체별로 측정 방법이 분산되어 있다는 점이 여전히 장벽으로 작용하고 있습니다. 광고주에게 도달 범위와 노출 빈도에 관한 신뢰할 수 있는 데이터를 제공할 수 있는 플랫폼은 리니어 방송 예산이 스트리밍으로 이동하는 가운데 아시아태평양의 광고용 주문형 비디오 시장에서 그 역할을 강화할 수 있을 것입니다.
모바일 우선 스트리밍과 합리적인 데이터 요금
많은 가구에게 모바일 접속은 여전히 아시아태평양의 광고용 주문형 비디오 시장으로 들어가는 주요 관문입니다. 통신 사업자들은 데이터 요금제와 동영상 서비스를 묶어 판매함으로써 이 모델을 지원하고 있으며, 이를 통해 선불 및 후불 고객 모두에게 스트리밍의 실질적인 비용이 절감되고 있습니다. 또한 이러한 번들링을 통해 플랫폼은 직접적인 소비자 유치에만 의존하지 않고도 대규모 가입자 기반을 확보할 수 있는 길을 열 수 있습니다. 인도와 동남아시아의 경우 저가형 스마트폰이 주요 개인용 화면으로 사용되는 경우가 많기 때문에 이는 특히 중요합니다. 또한 모바일 환경에서는 동의가 확보된 경우, 더 관련성 높은 광고를 전달하기 위한 방대한 양의 상거래 데이터와 시청 데이터가 생성됩니다. 통신 사업자와의 견고한 제휴 관계를 맺지 못한 플랫폼은 광고 전달력이 약화되고, 시청자 인사이트에 대한 접근도 제한될 가능성이 있습니다.
과도한 광고로 인한 피로감과 시청자 이탈
과도한 광고로 인한 피로감은 반복되는 광고나 타이밍이 좋지 않은 광고가 시청을 방해할 경우, 아시아태평양의 광고 포함 VOD 시장 성장을 제한할 가능성이 있습니다. The Trade Desk는 2025년 7월, 동남아시아 6개 시장의 소비자 중 66%가 단일 채널에서 반복적으로 노출되는 광고를 무시하고 있다고 보고했습니다. 해당 조사에서는 인도네시아, 필리핀, 태국에서 반복적으로 노출되는 광고에 대한 민감도가 특히 높은 것으로 나타났습니다. 동일한 가구가 노출 빈도 관리 기능을 공유하지 않는 여러 서비스에서 동일한 캠페인을 접하게 되면, 이 문제에 대응하기는 더욱 어려워집니다. 플랫폼 측은 서버 측 광고 삽입, 크리에이티브 로테이션, 그리고 보다 적절한 관련성 규칙 도입을 통해 이에 대응할 수 있습니다. 이러한 투자는 시청 세션을 보호하고, 아시아태평양의 광고 지원 비디오 온 디맨드(AVOD) 시장을 지탱하는 광고 인벤토리 유지에 기여할 것입니다.
부문별 분석
2025년, TV 프로그램 및 에피소드 형식 콘텐츠는 아시아태평양의 광고 지원 비디오 온 디맨드(AVOD) 시장의 36.38%를 차지했습니다. 연속 드라마나 리얼리티 프로그램은 여러 에피소드에 걸쳐 시청자의 관심을 유지하며, 각 시청 세션 내에서 더 많은 광고 기회를 창출할 수 있습니다. 또한, 이러한 반복 가능한 구조는 플랫폼이 신작 배포 일정을 수립하고 예측 가능한 콘텐츠 공급 체계를 유지하는 데에도 도움이 됩니다. 영화는 여전히 중요한 위치를 차지하고 있으며, 특히 일본과 한국에서는 극장 개봉작 카탈로그를 활용함으로써 완전한 오리지널 작품군을 제작하는 비용을 들이지 않고도 콘텐츠 라이브러리를 확충할 수 있습니다. 다큐멘터리는 금융, 건강, 비즈니스, 역사, 과학 등 보다 명확한 관심 분야를 대상으로 합니다. 이 시청자층은 폭넓은 엔터테인먼트가 제공하는 맥락보다는 보다 구체적인 맥락을 추구하는 광고주에게 유용합니다.
다큐멘터리는 2031년까지 연평균 성장률(CAGR) 12.18%로 확대될 것으로 예측되며, 이는 언급된 콘텐츠 형식 중 가장 높은 성장률입니다. 이 부문은 명확한 정보 습득을 목적으로 프로그램을 선택하는 시청자로부터 혜택을 볼 수 있으며, 관련성이 높은 광고에 대해 더 수용적일 가능성이 있습니다. 마이크로 드라마 또한 아시아태평양의 광고용 주문형 비디오 시장에서 다른 콘텐츠 카테고리의 역할을 변화시키고 있습니다. iQIYI는 2026년 7월, 자사의 마이크로 드라마 라이브러리가 5만 편을 돌파했다고 보고했습니다. 한편, 중국산 오리지널 애니메이션의 시청 시간은 전년 대비 98% 증가했습니다. 짧은 에피소드는 모바일 시청 습관에 부합하며, 장시간 시청을 요구하지 않으면서도 빈번한 광고 기회를 창출할 수 있습니다. 뉴스, 스포츠 하이라이트, 아카이브 프로그램 등을 포함한 FAST 콘텐츠는 방송사가 이용 가능한 라이브러리 권리를 관리하는 프로그램매틱 인벤토리의 새로운 공급원이 됩니다.
2025년 아시아태평양의 광고용 주문형 비디오 시장 규모 중 스마트폰 및 태블릿이 38.81%를 차지했습니다. 이러한 상황은 모바일 단말기의 높은 보급률과 인도 및 동남아시아에서 저가형 안드로이드 단말기가 주요 화면으로 기능하고 있음을 반영합니다. 스트리밍 접속을 포함한 모바일 요금제는 소비자가 시청을 시작하는 데 필요한 절차를 간소화합니다. 이 기기 카테고리는 플랫폼에 높은 도달률과 빈번한 일일 접점을 제공합니다. 또한, 숏폼 프로그램, 세로형 동영상 및 커머스 연계형 광고에 실용적인 환경을 제공합니다. 노트북과 데스크톱 PC는 특히 일본, 한국, 호주에서 업무용, 교육용 및 장편 콘텐츠 시청에 있어 여전히 중요한 역할을 하고 있습니다.
스마트 TV는 2031년까지 연평균 성장률(CAGR) 11.91%로 확대될 것으로 예측됩니다. 커넥티드 TV로의 전환은 아시아태평양의 광고용 주문형 비디오 시장 수익 구조를 변화시키고 있습니다. 이는 대형 화면의 광고 슬롯이 표준 모바일 광고 슬롯보다 더 높은 가격을 책정할 수 있기 때문입니다. 커넥티드 TV는 브랜드 광고, 라이브 이벤트, 그리고 시청자가 다른 사람들과 함께 시청하는 경향이 강한 장편 프로그램에서 특히 효과적입니다. 스마트 TV를 통한 시청은 모바일 이용을 대체하는 것이 아닙니다. 도달 범위나 일상적인 접근성 측면에서 모바일은 여전히 중요하기 때문입니다. 오히려 이러한 기기들은 서로 다른 요구를 충족시키며, 모바일은 규모를, 스마트 TV는 프리미엄 광고 슬롯을 뒷받침합니다. 두 화면 모두에서 일관된 광고 형식, 측정, 콘텐츠 경험을 제공하는 플랫폼이라면 이러한 양극화를 보다 적절하게 관리할 수 있습니다.
기타 혜택 :
- 엑셀 형식 시장 예측(ME) 시트
- 3개월간의 애널리스트 지원
자주 묻는 질문
목차
제1장 서론
제2장 조사 방법
제3장 개요
제4장 시장 구도
제5장 시장 규모 및 성장 예측
제6장 경쟁 구도
제7장 시장 기회 및 향후 전망
KTH 26.09.02According to Mordor Intelligence, the Asia-Pacific advertising video-on-demand market size is expected to grow from USD 23.21 billion in 2025 to USD 24.80 billion in 2026 and is forecast to reach USD 42.96 billion by 2031 at 11.61% CAGR over 2026-2031.
This report is Segmented by Content Type (Movies and Films, TV Shows and Episodic Content, and Documentaries), Device Type (Smartphones and Tablets, Smart TVs, and Laptops and Desktops), End-User (Media and Entertainment, Retail and E-Commerce, Education, and More), Ad Format (Pre-Roll, Mid-Roll, and Post-Roll), and Geography. The Market Forecasts are Provided in Terms of Value (USD).
Asia-Pacific Advertising Video-on-Demand Market Trends and Insights
Rising Connected TV Ad Spend Migration
Connected television is reshaping the Asia-Pacific advertising video-on-demand market because it combines wider household viewing with higher-value ad placements. Smart TVs provide a more suitable setting for longer creative formats, shared viewing, and premium brand campaigns than many mobile placements. Growing home broadband access and lower smart TV prices are expanding the available connected television audience across India, Australia, Japan, and South Korea. This supports a shift in platform strategy from reach alone toward the quality of attention and the price achieved for each impression. The move is still limited by fragmented measurement across platforms and device makers. A platform that gives advertisers a dependable view of reach and frequency can strengthen its role in the Asia-Pacific advertising video-on-demand (AVOD) market as linear budgets move to streaming.
Mobile-First Streaming and Affordable Data
Mobile access remains the main entry point to the Asia-Pacific advertising video-on-demand market for many households. Telecom operators support this model by bundling data plans with video services, which lowers the practical cost of streaming for prepaid and postpaid customers. These bundles also give platforms a route to large subscriber bases without relying only on direct consumer acquisition. India and Southeast Asia are especially important because low-cost smartphones are often the primary personal screen. The mobile environment also creates large volumes of commerce and viewing signals that can support more relevant advertising when consent is available. Platforms without strong telecom relationships may face weaker distribution and less access to audience intelligence.
Ad-Load Fatigue and Viewer Churn
Ad-load fatigue can limit growth in the Asia-Pacific advertising video-on-demand market when repeated or poorly timed commercials interrupt viewing. The Trade Desk reported in July 2025 that 66% of consumers across 6 Southeast Asian markets tuned out repetitive ads shown on a single channel. Indonesia, the Philippines, and Thailand showed particularly high sensitivity to repeated exposure in that research. The problem is harder to manage when the same household sees a campaign across several services that do not share frequency controls. Platforms can respond through server-side ad insertion, creative rotation, and better relevance rules. Those investments can protect viewing sessions and help preserve the advertising inventory that supports the Asia-Pacific advertising video-on-demand (AVOD) market.
Other drivers and restraints analyzed in the detailed report include:
- Localized and Multilingual Content Supply
- FAST and Broadcaster Library Monetization
- Privacy-Led Targeting Constraints
For complete list of drivers and restraints, kindly check the Table Of Contents.
Segment Analysis
TV shows and episodic content held 36.38% of the Asia-Pacific advertising video-on-demand market in 2025. Serialized drama and reality formats can keep viewers engaged across several episodes and create more advertising opportunities within each session. Their repeatable structure also helps platforms schedule new releases and maintain a predictable content pipeline. Movies and films remain important, particularly in Japan and South Korea, where theatrical catalogs can add library depth without the cost of a fully original slate. Documentary viewing serves more defined interests, including finance, health, business, history, and science. This audience profile can be useful for advertisers seeking more specific contexts than broad entertainment provides.
Documentaries are projected to expand at a 12.18% CAGR through 2031, the highest rate among the listed content formats. The segment can benefit from viewers who select programs for clear informational purposes and may be more receptive to relevant advertising. Micro-dramas are also changing the role of other content categories in the Asia-Pacific advertising video-on-demand market. iQIYI reported in July 2026 that its micro-drama library had surpassed 50,000 titles, while original Chinese animation viewing duration rose 98% year over year. Short episodes fit mobile viewing habits and can support frequent ad opportunities without requiring long viewing sessions. FAST content, including news, sports highlights, and catalog programming, adds another source of programmatic inventory where broadcasters control usable library rights.
Smartphones and tablets accounted for 38.81% of the Asia-Pacific advertising video-on-demand market size in 2025. This position reflects widespread mobile ownership and the role of low-cost Android devices as primary screens in India and Southeast Asia. Mobile plans that include streaming access reduce the steps required for consumers to begin viewing. The device category gives platforms high reach and frequent daily touchpoints. It also provides a practical environment for short-form programming, vertical video, and commerce-linked advertising. Laptops and desktops remain relevant for professional, educational, and longer-form viewing, especially in Japan, South Korea, and Australia.
Smart TVs are projected to expand at an 11.91% CAGR through 2031. The shift toward connected television changes the revenue profile of the Asia-Pacific advertising video-on-demand market because big-screen placements can command stronger prices than standard mobile inventory. Connected television is particularly useful for brand advertising, live events, and long-form programming where viewers are more likely to watch with others. Smart TV viewing does not replace mobile use, since mobile remains important for reach and everyday access. Instead, the devices serve different needs, with mobile supporting scale and smart TVs supporting premium inventory. Platforms that offer consistent ad formats, measurement, and content experiences across both screens can better manage this split.
Complete Report Scope:
- By Content Type
- Movies and Films
- TV Shows and Episodic Content
- Documentaries
- Other Content Types
- By Device Type
- Smartphones and Tablets
- Smart TVs
- Laptops and Desktops
- Other Device Types
- By End-User
- Media and Entertainment
- Retail and E-Commerce
- Banking, Financial Services and Insurance
- Education
- Information Technology and Telecommunications
- Healthcare
- Other End-User Industries
- By Ad Format
- Pre-Roll
- Mid-Roll
- Post-Roll
- By Geography
- China
- India
- Japan
- South Korea
- Australia
- Indonesia
- Rest of Asia-Pacific
List of Companies Covered in this Report:
- Alphabet Inc.
- Tencent Holdings Limited
- JioStar India Private Limited
- ByteDance Ltd.
- iQIYI, Inc.
- Amazon.com, Inc.
- Netflix, Inc.
- The Walt Disney Company
- Sony Corporation
- PCCW Limited
- PT Surya Citra Media Tbk
- NAVER Corporation
- Kakao Corp.
- LG Electronics Inc.
- Samsung Electronics Co., Ltd.
- Rakuten Group, Inc.
- Roku, Inc.
- Paramount Skydance Corporation
- Fox Corporation
- Warner Bros. Discovery, Inc.
- Comcast Corporation
- Zee Entertainment Enterprises Limited
- TV Asahi Corporation
- CyberAgent, Inc.
Additional Benefits:
- The market estimate (ME) sheet in Excel format
- 3 months of analyst support
TABLE OF CONTENTS
1 INTRODUCTION
- 1.1 Study Assumptions and Market Definition
- 1.2 Scope of the Study
2 RESEARCH METHODOLOGY
3 EXECUTIVE SUMMARY
4 MARKET LANDSCAPE
- 4.1 Market Overview
- 4.2 Market Drivers
- 4.2.1 Rising Connected TV Ad Spend Migration
- 4.2.2 Mobile-First Streaming and Affordable Data
- 4.2.3 Localized and Multilingual Content Supply
- 4.2.4 FAST and Broadcaster Library Monetization
- 4.2.5 Commerce Signal-Led and Shoppable CTV
- 4.2.6 Micro-Drama and AI-Enabled Content Localization
- 4.3 Market Restraints
- 4.3.1 Ad-Load Fatigue and Viewer Churn
- 4.3.2 Privacy-Led Targeting Constraints
- 4.3.3 Cross-Platform Measurement and Invalid Traffic Leakage
- 4.3.4 Rights Fragmentation and Local Censorship Friction
- 4.4 Industry Value Chain Analysis
- 4.5 Regulatory Landscape
- 4.6 Technological Outlook
- 4.7 Porter's Five Forces Analysis
- 4.7.1 Bargaining Power of Suppliers Analysis
- 4.7.2 Bargaining Power of Buyers Analysis
- 4.7.3 Threat of New Entrants Analysis
- 4.7.4 Threat of Substitutes Analysis
- 4.7.5 Competitive Rivalry Analysis
5 MARKET SIZE AND GROWTH FORECASTS (VALUE)
- 5.1 By Content Type
- 5.1.1 Movies and Films
- 5.1.2 TV Shows and Episodic Content
- 5.1.3 Documentaries
- 5.1.4 Other Content Types
- 5.2 By Device Type
- 5.2.1 Smartphones and Tablets
- 5.2.2 Smart TVs
- 5.2.3 Laptops and Desktops
- 5.2.4 Other Device Types
- 5.3 By End-User
- 5.3.1 Media and Entertainment
- 5.3.2 Retail and E-Commerce
- 5.3.3 Banking, Financial Services and Insurance
- 5.3.4 Education
- 5.3.5 Information Technology and Telecommunications
- 5.3.6 Healthcare
- 5.3.7 Other End-User Industries
- 5.4 By Ad Format
- 5.4.1 Pre-Roll
- 5.4.2 Mid-Roll
- 5.4.3 Post-Roll
- 5.5 By Geography
- 5.5.1 China
- 5.5.2 India
- 5.5.3 Japan
- 5.5.4 South Korea
- 5.5.5 Australia
- 5.5.6 Indonesia
- 5.5.7 Rest of Asia-Pacific
6 COMPETITIVE LANDSCAPE
- 6.1 Market Concentration
- 6.2 Strategic Moves
- 6.3 Market Share Analysis
- 6.4 Company Profiles (includes Global Level Overview, Market Level Overview, Core Segments, Financials as available, Strategic Information, Market Rank/Share, Products and Services, Recent Developments)
- 6.4.1 Alphabet Inc.
- 6.4.2 Tencent Holdings Limited
- 6.4.3 JioStar India Private Limited
- 6.4.4 ByteDance Ltd.
- 6.4.5 iQIYI, Inc.
- 6.4.6 Amazon.com, Inc.
- 6.4.7 Netflix, Inc.
- 6.4.8 The Walt Disney Company
- 6.4.9 Sony Corporation
- 6.4.10 PCCW Limited
- 6.4.11 PT Surya Citra Media Tbk
- 6.4.12 NAVER Corporation
- 6.4.13 Kakao Corp.
- 6.4.14 LG Electronics Inc.
- 6.4.15 Samsung Electronics Co., Ltd.
- 6.4.16 Rakuten Group, Inc.
- 6.4.17 Roku, Inc.
- 6.4.18 Paramount Skydance Corporation
- 6.4.19 Fox Corporation
- 6.4.20 Warner Bros. Discovery, Inc.
- 6.4.21 Comcast Corporation
- 6.4.22 Zee Entertainment Enterprises Limited
- 6.4.23 TV Asahi Corporation
- 6.4.24 CyberAgent, Inc.
7 MARKET OPPORTUNITIES AND FUTURE OUTLOOK
- 7.1 White-Space and Unmet-Need Assessment


