

|
시장보고서
상품코드
2124943
아시아태평양의 창고 자동화 : 시장 점유율 분석, 업계 동향 및 통계, 성장 예측(2026-2031년)Asia-Pacific Warehouse Automation - Market Share Analysis, Industry Trends & Statistics, Growth Forecasts (2026 - 2031) |
||||||
 Mordor Intelligence
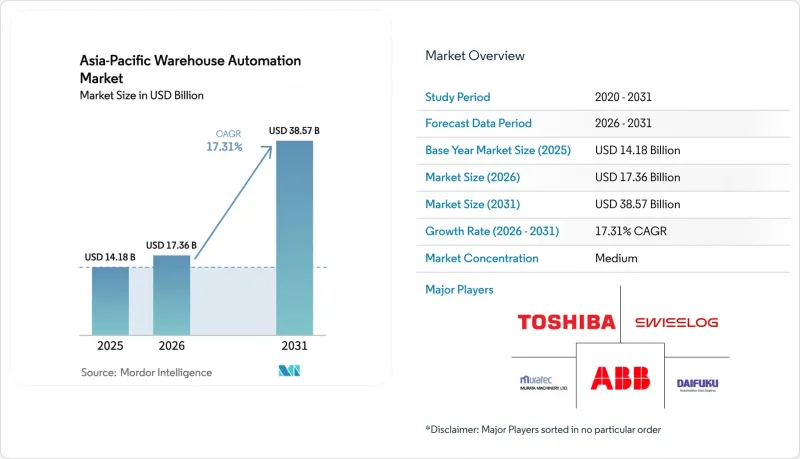
Mordor Intelligence에 의하면, 아시아태평양의 창고 자동화 시장 규모는 2025년 141억 8,000만 달러로 평가되었습니다. 2026년에는 173억 6,000만 달러로 확대되어 2031년까지 385억 7,000만 달러에 이를 것으로 예상되고 2026-2031년에 걸쳐 CAGR 17.31%로 성장할 전망입니다.
본 보고서에서는 산업을 ‘구성 요소’(하드웨어, 소프트웨어(창고 관리 시스템(WMS), 창고 실행 시스템(WES)), 서비스(부가가치 서비스, 유지보수)), ‘최종 사용자’(식음료, 우편·소포, 식료품, 일반 상품,의류, 제조업, 기타 최종 사용자), ‘국가’별로 분류하고 있습니다. 시장 전망은 금액(달러) 기준으로 제시되어 있습니다.
아시아태평양의 창고 자동화 시장 동향 및 인사이트
전자상거래 산업의 급성장과 당일 배송에 대한 기대
동남아시아의 전자상거래 총 상품 가치는 2024년에 1,390억 달러에 달했으며, 전년 대비 15%의 급증으로 인해 자카르타와 마닐라 전역에서 배송 리드타임이 촉박해졌습니다. 2024년 중국의 ‘싱글스 데이’에는 각 플랫폼이 72시간 동안 29억 개의 소포를 처리했으며, 물류 사업자들은 시간당 3만 개의 화물을 처리할 수 있는 분류 로봇을 도입할 수밖에 없었습니다. 인도에서는 2024년 온라인 구매자의 58%가 가전제품 및 의류 주문에 대해 당일 배송을 기대했으며, 이는 2년 전 41%에서 상승한 수치입니다. 이에 따라 창고에서는 피킹 및 포장 업무의 자동화가 시급한 과제가 되고 있습니다. 아마존 인도는 ‘Goods-to-Person(상품에서 사람으로)’ 방식의 로봇 도입을 통해 주문에서 출하까지의 시간을 40% 단축하고, 15개 대도시권에서 2시간 이내 배송을 실현했다고 보고했습니다. 도시 지역 수요 급증으로 인해 고객으로부터 5킬로미터 반경 내에 위치한 마이크로 풀필먼트 허브로 자본 유입이 진행되고 있으며, 이곳에서는 자동화를 통해 도시 지역의 부동산 가격 급등을 상쇄하고 있습니다.
‘인더스트리 4.0’ 프로그램을 통한 스마트 제조에 대한 정부의 지원책
일본은 2024년도에 협동 로봇 및 창고 운영 시스템에 대한 보조금으로 2,000억 엔(18억 달러)을 편성했으며, 2027년까지 물류의 50% 자동화를 목표로 하고 있습니다. 중국의 ‘제14차 5개년 계획’에서는 2025년까지 콜드체인 창고의 70%를 기계화하도록 의무화했으며, 이에 따라 식품 폐기물과 주문당 에너지 소비를 줄여주는 셔틀 및 AS/RS 시스템의 도입이 가속화되었습니다. 한국은 2024년에 5억 달러 규모의 ‘스마트 물류 혁신 기금’을 조성하여, 중소기업용 이동형 로봇에 대한 자본 지출의 최대 40%를 지원했습니다. 2024년에 발표된 인도의 ‘생산 연계형 인센티브 제도’에서는 2028년까지 자동화를 도입하는 창고에 대해 증수분의 6%에 해당하는 세액 공제가 제공됩니다. 이러한 재정적 지원책 덕분에 일반적인 투자 회수 기간이 5년에서 3년 미만으로 단축되어, 중견 3PL 사업자에게는 과거에는 감당할 수 없습니다고 여겨졌던 프로젝트도 실현 가능해집니다.
막대한 설비 투자와 긴 회수 기간
10만 제곱피트 규모의 창고에 자동화 창고 시스템을 도입할 경우, 일반적으로 800만-1,500만 달러의 비용이 소요되며, 임금 격차에 따라 다르지만 투자 회수 기간은 3년에서 5년 정도 걸립니다. 자율 주행 로봇의 가격은 1대당 2만-10만 달러이며, 50대 규모의 차량을 도입할 경우 초기 비용은 100만 달러를 초과하고, 여기에 하드웨어 비용의 약 20%에 해당하는 연간 소프트웨어 사용료도 발생합니다. 2024년 인도의 상업 대출 금리는 평균 9.5%로, 이로 인해 가중평균자본비용이 상승하여 이익률이 낮은 사업자의 경우 손익분기점 달성 시기가 늦춰지게 됩니다. 로봇 1대당 월 2,000-4,000달러의 RaaS(Robotics-as-a-Service) 계약은 진입 장벽을 낮추지만, 5년간의 총 비용을 20-30% 끌어올리게 됩니다. 이러한 자금 조달 장벽으로 인해 온라인 소매가 견조한 성장세를 보이고 있음에도 불구하고, 베트남과 인도네시아의 자동화 보급률은 12% 미만에 머물고 있습니다.
부문별 분석
서비스 매출은 연평균 성장률(CAGR) 17.93%로 확대되고 있으며, 이는 하드웨어의 17.31%를 소폭 상회하는 수치입니다. 이는 사업자들이 프로젝트의 성공이 기존 ERP, WMS, OT 계층과의 원활한 통합에 달려 있다는 사실을 깨닫기 시작했기 때문입니다. 2025년에도 하드웨어는 아시아태평양의 창고 자동화 시장의 67.13%를 차지했으며, 그 주된 이유는 이동 로봇, 셔틀 시스템, 컨베이어가 여전히 처리 능력 향상의 기반이 되고 있기 때문입니다. 이동 로봇군만으로도 부품 매출의 28%를 차지하고 있는데, 이는 야마토 물류에서 1,000대의 Geek+를 도입하여 처리 시간을 35% 단축한 사례가 뒷받침하고 있습니다. 소프트웨어는 18%의 시장 점유율을 차지하고 있으며, 실시간 제어 및 예측 유지보수가 성숙해짐에 따라 그 성장이 가속화되고 있습니다. 이는 Blue Yonder와 Manhattan Associates의 WMS 라이선스가 40% 급증한 사실에서도 분명히 드러납니다.
2024년 조사 대상 사업자의 68%가 IT와 OT의 융합을 최대 과제로 꼽은 만큼, 시스템 통합사업자가 가장 큰 혜택을 볼 것으로 전망됩니다. 컨설팅 사업에서는 현재 프로세스 재설계, 안전 인증, 직원 역량 강화를 다년 계약에 포함시킴으로써 서비스 이익률을 높이고 있습니다. 하드웨어 벤더들은 이에 대응하여 엔드투엔드 패키지를 제공하고 있지만, 많은 중규모 3PL 기업들은 혼재된 설비를 통합할 수 있는 중립적인 자문가를 선호하고 있습니다. 창고의 복잡성이 증가하고 아시아태평양의 창고 자동화 시장이 확대됨에 따라, 사이버 보안을 고려한 통합에 대한 수요가 단순한 기계적 업그레이드의 매력을 대체하고 있습니다.
식료품점은 엄격한 온도 관리 요건과 1시간 이내 배송 시간대 확산으로 인해 기계화된 냉장 창고에 대한 자본 배분이 가속화되어 18.77%라는 가장 높은 연평균 성장률(CAGR)을 기록하고 있습니다. 2025년 아시아태평양의 창고 자동화 시장에서 식음료 부문은 23.44%라는 최대 점유율을 유지했으며, 이는 팔레타이징 로봇을 사용하여 반복적인 케이스 처리를 효율화하는 음료 도매업체들에 의해 뒷받침되었습니다. 중국에서는 2025년까지 콜드체인 시설의 70%를 자동화하도록 정부가 의무화하고 있으며, SF 익스프레스(SF Express)와 같은 운송 사업자들은 -25°C에서 +15°C까지의 온도 범위를 지원하는 멀티존 AS/RS 시스템 도입을 추진하고 있습니다.
우편·소포 부문은 시간당 1만 8,000개 이상의 소포를 처리하는 허브 거점의 고속 분류기를 원동력으로 삼아 2025년 매출의 19%를 차지했습니다. 의류 및 일반 상품 부문은 22%를 차지했으나, SKU의 다양성으로 인한 자동화 지연이 로봇의 집적 작업을 복잡하게 만들고 있습니다. 제조 부문은 16%를 차지했으며, 자동차 및 전자기기 공장에서는 안전성 향상과 공간 활용도 제고를 위해 AGV가 활용되고 있습니다. 의약품, 화학제품 및 기타 틈새 부문에서는 자동화된 데이터 수집을 촉진하는 추적성 기준이 확대되고 있습니다. 전반적으로 식료품, 특히 냉동 식품 및 신선 식품에 대한 수요 증가가 아시아태평양의 창고 자동화 시장을 기존 소포 배송 업체에 대한 의존에서 벗어나게 하고 있습니다.
기타 혜택
- 엑셀 형식 시장 예측(ME) 시트
- 3개월간의 애널리스트 지원
자주 묻는 질문
목차
제1장 서론
제2장 조사 방법
제3장 주요 요약
제4장 시장 구도
제5장 시장 규모 및 성장 예측
제6장 경쟁 구도
제7장 시장 기회 및 향후 전망
KTH 26.09.14According to Mordor Intelligence, the Asia-Pacific warehouse automation market size is expected to increase from USD 14.18 billion in 2025 to USD 17.36 billion in 2026 and reach USD 38.57 billion by 2031, growing at a CAGR of 17.31% over 2026-2031.
This report Segments the Industry Into Component (Hardware, Software (Warehouse Management Systems (WMS), Warehouse Execution Systems (WES)), Services (Value Added Services, Maintenance)), End-User (Food and Beverage, Post and Parcel, Groceries, General Merchandise, Apparel, Manufacturing, Other End-User Industries), and Country. The Market Forecasts are Provided in Terms of Value (USD).
Asia-Pacific Warehouse Automation Market Trends and Insights
Exponential Growth of the E-commerce Industry and Same-Day Delivery Expectations
Southeast Asia's e-commerce gross merchandise value reached USD 139 billion in 2024, a 15% year-on-year jump that tightened delivery windows across Jakarta and Manila. During China's Singles' Day 2024, platforms processed 2.9 billion parcels in 72 hours, forcing logistics providers to adopt sortation robots capable of handling 30,000 packages per hour. In India, 58% of online shoppers expected same-day service for electronics and apparel orders in 2024, up from 41% two years earlier, putting pressure on warehouses to automate pick-and-pack flows. Amazon India reported that goods-to-person robotics trimmed order-to-dispatch time by 40%, enabling two-hour delivery in 15 metropolitan areas. The surge in urban demand is pushing capital toward micro-fulfillment hubs within 5 kilometers of customers, where automation offsets urban real estate premiums.
Government Incentives for Smart Manufacturing Under Industry 4.0 Programs
Japan earmarked JPY 200 billion (USD 1.8 billion) in fiscal 2024 to subsidize collaborative robots and warehouse execution systems, aiming for 50% logistics automation by 2027. China's 14th Five-Year Plan mandates 70% mechanization in cold-chain warehouses by 2025, accelerating the deployment of shuttles and AS/RS systems that reduce food waste and energy per order. South Korea launched a USD 500 million Smart Logistics Innovation Fund in 2024, covering up to 40% of capital outlays for mobile robots for small and medium operators. India's Production-Linked Incentive scheme, announced in 2024, provides tax credits equal to 6% of incremental revenue for warehouses installing automation through 2028. These fiscal levers shorten typical payback periods from five years to under three, unlocking projects that mid-tier 3PLs once deemed unaffordable.
High Capital Expenditure and Long Payback Periods
Installing an automated storage and retrieval system for a 100,000 ft2 warehouse typically costs USD 8-15 million, with payback stretching three to five years depending on wage differentials. Autonomous mobile robots price between USD 20,000 and USD 100,000 each, and fleets of 50 units push upfront spend beyond USD 1 million, plus annual software fees near 20% of the hardware cost. Commercial loan rates in India averaged 9.5% in 2024, thereby inflating the weighted-average cost of capital and extending breakeven timelines for thin-margin operators. Robotics-as-a-service contracts at USD 2,000-4,000 per robot per month lower barriers but raise the total five-year cost 20-30%. These financing hurdles leave automation penetration below 12% in Vietnam and Indonesia, despite robust online retail growth.
Other drivers and restraints analyzed in the detailed report include:
- Rising Labor Costs Amid Aging Workforce in Developed Asia-Pacific Economies
- Surge in Dark Stores and Micro-Fulfillment Adoption in Urban Centers
- Availability of Low-Cost Labor in Emerging Economies
For complete list of drivers and restraints, kindly check the Table Of Contents.
Segment Analysis
Services revenue is growing at a 17.93% CAGR, slightly outpacing hardware's 17.31% trajectory, as operators discover that successful projects hinge on the smooth integration of legacy ERP, WMS, and OT layers. In 2025, hardware still delivered 67.13% of the Asia-Pacific warehouse automation market, largely because mobile robots, shuttle systems, and conveyors remain the backbone of throughput gains. Mobile fleets alone accounted for 28% of component turnover, buoyed by deployments such as 1,000 Geek+ units at Yamato Logistics, which trimmed processing time by 35%. Software captured 18% market share and is accelerating as real-time control and predictive maintenance mature, evidenced by a 40% jump in Blue Yonder and Manhattan Associates WMS licenses.
System integrators stand to benefit most, as 68% of operators surveyed in 2024 cited IT-OT convergence as their top hurdle. Consulting lines now bundle process redesign, safety certification, and workforce upskilling into multi-year contracts, swelling service margins. Hardware vendors respond by offering end-to-end packages, yet many mid-sized 3PLs prefer neutral advisers who can orchestrate mixed fleets. As warehouse complexity rises and the Asia-Pacific warehouse automation market expands, demand for cyber-secure integration eclipses the allure of marginal mechanical upgrades.
Grocery stores register the fastest 18.77% CAGR as strict temperature compliance and one-hour delivery windows intensify capital allocation toward mechanized cold storage. Food and beverage retained the largest 23.44% share of the Asia-Pacific warehouse automation market in 2025, underpinned by beverage distributors that streamline repetitive case handling with palletizing robots. State mandates in China require 70% mechanization of cold-chain sites by 2025, prompting carriers like SF Express to adopt multi-zone AS/RS systems with temperature ranges from -25 °C to +15 °C.
Post and parcel accounted for 19% of 2025 revenue, driven by high-speed sorters at hubs processing over 18,000 parcels per hour. Apparel and general merchandise accounted for 22%, but slower automation due to SKU variability complicates robotic grasping. Manufacturing accounted for 16%, with auto and electronics plants using AGVs to improve safety and increase space utilization. Pharmaceuticals, chemicals, and other niches expand on traceability standards that reward automated data capture. Overall, grocery momentum, especially for frozen and fresh produce, is driving the Asia-Pacific warehouse automation market beyond its historical reliance on parcel carriers.
Complete Report Scope:
- By Component
- Hardware
- Mobile Robots (AGV, AMR)
- Automated Storage and Retrieval Systems (AS/RS)
- Automated Conveyor and Sorting Systems
- De-palletizing/Palletizing Systems
- Automatic Identification and Data Collection (AIDC)
- Piece Picking Robots
- Software
- Warehouse Management Systems (WMS)
- Warehouse Execution Systems (WES)
- Services
- Hardware
- By End-User
- Food and Beverage
- Post and Parcel
- Groceries
- General Merchandise
- Apparel
- Manufacturing (Durable and Non-Durable)
- Other End-User
- By Warehouse Function
- Distribution Centers
- Fulfillment Centers
- Return Centers
- Cold Storage Facilities
- Micro-Fulfillment Centers
- Dark Stores
- By Warehouse Size
- Small (Below 50 000 sq ft)
- Medium (50 000 - 250 000 sq ft)
- Large (Above 250 000 sq ft)
- By Country
- China
- India
- Japan
- South Korea
- Australia
- Rest of Asia Pacific
List of Companies Covered in this Report:
- Daifuku Co., Ltd.
- Murata Machinery, Ltd.
- Geek+ Inc.
- GreyOrange Pte. Ltd.
- SSI Schaefer Group
- Swisslog Holding AG
- Toyota Material Handling
- HAI Robotics
- ABB Ltd.
- Yaskawa Electric Corporation
- Godrej Consoveyo Logistics Automation Ltd.
- Bastian Solutions
- ST Engineering
- Toshiba Global Commerce Solutions
- Vanderlande Industries
- Honeywell Intelligrated
- Knapp AG
- Locus Robotics Corp.
- Kion Group
Additional Benefits:
- The market estimate (ME) sheet in Excel format
- 3 months of analyst support
TABLE OF CONTENTS
1 INTRODUCTION
- 1.1 Study Assumptions and Market Definition
- 1.2 Scope of the Study
2 RESEARCH METHODOLOGY
3 EXECUTIVE SUMMARY
4 MARKET LANDSCAPE
- 4.1 Market Overview
- 4.2 Market Drivers
- 4.2.1 Exponential Growth of the E-commerce Industry and Same-Day Delivery Expectations
- 4.2.2 Government Incentives for Smart Manufacturing Under Industry 4.0 Programs
- 4.2.3 Rising Labor Costs Amid Aging Workforce in Developed Asia Pacific Economies
- 4.2.4 Surge in Dark Store and Micro-Fulfillment Adoption in Urban Centers
- 4.2.5 Deployment of 5G Private Networks Enabling Ultra-Low-Latency Warehouse Control
- 4.2.6 Decarbonization Mandates Driving Automation to Reduce Energy per Order
- 4.3 Market Restraints
- 4.3.1 High Capital Expenditure and Long Payback Periods
- 4.3.2 Availability of Low-Cost Labor in Emerging Economies
- 4.3.3 Complexity of Integrating Legacy IT and OT Systems
- 4.3.4 Cybersecurity Vulnerabilities in Connected Robotic Fleets
- 4.4 Industry Value Chain Analysis
- 4.5 Regulatory Landscape
- 4.6 Technological Outlook
- 4.7 Impact of Macroeconomic Factors on the Warehouse Automation Market
- 4.8 Impact of COVID-19 on the Market
- 4.9 Warehouse Investment Scenario
- 4.10 Porter's Five Forces Analysis
- 4.10.1 Threat of New Entrants
- 4.10.2 Bargaining Power of Buyers
- 4.10.3 Bargaining Power of Suppliers
- 4.10.4 Threat of Substitutes
- 4.10.5 Intensity of Competitive Rivalry
5 MARKET SIZE AND GROWTH FORECASTS (VALUE)
- 5.1 By Component
- 5.1.1 Hardware
- 5.1.1.1 Mobile Robots (AGV, AMR)
- 5.1.1.2 Automated Storage and Retrieval Systems (AS/RS)
- 5.1.1.3 Automated Conveyor and Sorting Systems
- 5.1.1.4 De-palletizing/Palletizing Systems
- 5.1.1.5 Automatic Identification and Data Collection (AIDC)
- 5.1.1.6 Piece Picking Robots
- 5.1.2 Software
- 5.1.2.1 Warehouse Management Systems (WMS)
- 5.1.2.2 Warehouse Execution Systems (WES)
- 5.1.3 Services
- 5.1.1 Hardware
- 5.2 By End-User
- 5.2.1 Food and Beverage
- 5.2.2 Post and Parcel
- 5.2.3 Groceries
- 5.2.4 General Merchandise
- 5.2.5 Apparel
- 5.2.6 Manufacturing (Durable and Non-Durable)
- 5.2.7 Other End-User
- 5.3 By Warehouse Function
- 5.3.1 Distribution Centers
- 5.3.2 Fulfillment Centers
- 5.3.3 Return Centers
- 5.3.4 Cold Storage Facilities
- 5.3.5 Micro-Fulfillment Centers
- 5.3.6 Dark Stores
- 5.4 By Warehouse Size
- 5.4.1 Small (Below 50 000 sq ft)
- 5.4.2 Medium (50 000 - 250 000 sq ft)
- 5.4.3 Large (Above 250 000 sq ft)
- 5.5 By Country
- 5.5.1 China
- 5.5.2 India
- 5.5.3 Japan
- 5.5.4 South Korea
- 5.5.5 Australia
- 5.5.6 Rest of Asia Pacific
6 COMPETITIVE LANDSCAPE
- 6.1 Market Concentration
- 6.2 Strategic Moves
- 6.3 Market Share Analysis
- 6.4 Company Profiles (includes Global Level Overview, Market Level Overview, Core Segments, Financials as Available, Strategic Information, Market Rank/Share for Key Companies, Products and Services, and Recent Developments)
- 6.4.1 Daifuku Co., Ltd.
- 6.4.2 Murata Machinery, Ltd.
- 6.4.3 Geek+ Inc.
- 6.4.4 GreyOrange Pte. Ltd.
- 6.4.5 SSI Schaefer Group
- 6.4.6 Swisslog Holding AG
- 6.4.7 Toyota Material Handling
- 6.4.8 HAI Robotics
- 6.4.9 ABB Ltd.
- 6.4.10 Yaskawa Electric Corporation
- 6.4.11 Godrej Consoveyo Logistics Automation Ltd.
- 6.4.12 Bastian Solutions
- 6.4.13 ST Engineering
- 6.4.14 Toshiba Global Commerce Solutions
- 6.4.15 Vanderlande Industries
- 6.4.16 Honeywell Intelligrated
- 6.4.17 Knapp AG
- 6.4.18 Locus Robotics Corp.
- 6.4.19 Kion Group
7 MARKET OPPORTUNITIES AND FUTURE OUTLOOK
- 7.1 White-Space and Unmet-Need Assessment


