

|
시장보고서
상품코드
2154724
RAN 계획 및 최적화 소프트웨어 : 시장 점유율 분석, 업계 동향과 통계, 성장 예측(2026-2031년)RAN Planning and Optimization Software - Market Share Analysis, Industry Trends & Statistics, Growth Forecasts (2026 - 2031) |
||||||
 Mordor Intelligence
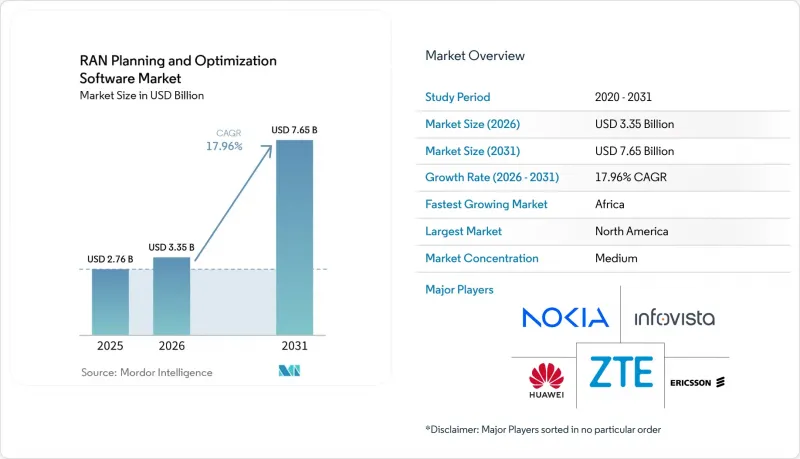
에 따르면 RAN 계획 및 최적화 소프트웨어 시장 규모는 2025년에 27억 6,000만 달러로 평가되며, 2026년 33억 5,000만 달러에서 2031년까지 76억 5,000만 달러에 달할 것으로 예측되며, 예측 기간(2026-2031년) 동안 CAGR은 17.96%가 될 전망입니다.
세계 RAN 계획 및 최적화 소프트웨어 시장의 동향과 인사이트
5G 네트워크의 고밀도화와 멀티 테크놀러지의 복잡화
5G 네트워크는 광범위한 영역을 커버하는 매크로셀에서 더 고밀도인 스몰셀 네트워크로 전환되고 있습니다. 또한 통신 사업자는 2G, 3G, 4G, 5G 각 계층을 동시에 관리하고 있습니다. 각 사이트의 가동 개시는 셀 에지 간섭 패턴을 변화시켜 추가적인 기술적 작업을 필요로 할 수 있습니다. RAN 계획 및 최적화 소프트웨어 시장은 팀이 정기적인 네트워크 재검토가 아닌 지속적인 재최적화가 필요한 경우에 이점을 제공합니다. Forsk사의 ‘Naos’는 서비스 기반 아키텍처를 통해 5G 사이트 선정 자동화 및 국가 차원의 전송 손실 계산을 지원합니다. 무선 구성이 점점 더 복잡해짐에 따라, 이러한 기능들은 통신 사업자의 제안 요청서에서 그 중요성이 커지고 있습니다.
클라우드 네이티브이자 AI를 활용한 자율형 RAN 운영
클라우드 네이티브 아키텍처 덕분에 계획 도구는 데스크톱 라이선스에서 구독 서비스 및 애플리케이션 프로그래밍 인터페이스(API)로 전환되고 있습니다. 이러한 변화로 인해 소프트웨어 공급업체는 하드웨어 업데이트를 기다리지 않고도 계획 로직을 업데이트할 수 있게 되었습니다. 에릭슨은 2026년, 스케줄러, 빔포밍, 위치 파악, 가시성 기능을 갖춘 ‘AI in RAN’ 소프트웨어의 구독 서비스를 시작했습니다. 이 회사는 이 패키지가 AI 기능을 무선 운영에 더 가까운 위치에 배치하도록 설계되었다고 밝혔습니다. 최적화가 배치 분석에서 정기적인 네트워크 관리로 전환됨에 따라, RAN 계획 및 최적화 소프트웨어 시장에는 지속적인 수익 기회가 창출됩니다. 이 모델을 통해 계획상의 결정과 운영 능력 및 서비스 품질 간의 연관성도 더욱 밀접해집니다.
통신 사업자의 통합 및 소프트웨어 구매의 중앙 집중화
통신 사업자의 통합으로 인해 독자적으로 소프트웨어를 구매하는 조직의 수가 감소할 것입니다. 합병된 통신 사업자는 다년 계약, 수량 할인, 그리고 계획 및 최적화 기능을 결합한 계약을 요구할 가능성이 있습니다. 이러한 요구 사항으로 인해 RAN 계획 및 최적화 소프트웨어 시장의 공급업체에게는 단위당 수익이 감소할 가능성이 있습니다. 또한, 합병된 엔지니어링 팀이 기술 아키텍처를 통합하는 동안 네트워크 도구 선정이 지연될 가능성이 있습니다. 이러한 평가로 인해 제안 요청서(RFP) 주기가 12-24개월 연장될 수 있습니다. 두 통신 사업자의 운영 지원 시스템(OSS)과의 통합을 실현한 공급업체는 네트워크 합리화 계획이 승인될 때 더 유리한 입장에 설 수 있습니다.
부문 분석
소프트웨어는 2025년 시장 규모의 67.98%를 차지하고 있으며, 2031년까지 연평균 성장률(CAGR) 18.71%로 성장할 것으로 예측됩니다. 이 부문은 하드웨어 교체 주기를 기다리지 않고 최신 계획 로직 및 AI 기능을 원하는 통신 사업자의 수요를 반영하고 있습니다. 구독 모델을 통해 공급업체는 정기적인 상용 계약을 통해 새로운 기능을 제공할 수 있게 됩니다. 노키아는 2026년, 기능 제공에 소프트웨어 구독 모델을 채택한 AI 네이티브 RAN 플랫폼을 도입했습니다. 이러한 접근 방식은 계획, 무선 운영 및 최적화 기능의 지속적인 개선을 지원합니다. 또한, 네트워크 변경에 지연이 발생하기 쉬운 고정 버전 도구 릴리스에 대한 의존도를 낮춥니다. RAN 계획 및 최적화 소프트웨어 업계의 소프트웨어 부문은 혼합 무선 환경에서 벤더 중립적인 기능에 대한 수요에 힘입어 성장하고 있습니다.
서비스에는 도입, 시스템 통합 및 관리형 운영 지원이 포함됩니다. 이는 사내 무선 엔지니어링 자원이 제한적인 경우 통신 사업자가 도구를 설정할 수 있도록 지원합니다. 통신 사업자가 주파수 대역, 기술 세대 및 Open RAN 구성요소를 추가함에 따라 통합 작업의 중요성은 더욱 커지고 있습니다. 아프리카 및 남미의 통신 사업자는 새로운 도구를 기존 운영 지원 시스템과 통합하기 위해 외부 지원이 필요할 수 있습니다. 따라서 소프트웨어가 여전히 주요 구성요소인 경우에도 라이선스 수익과는 별도로 서비스 수익이 증가할 가능성이 있습니다. 소프트웨어와 장기적인 관리형 서비스를 결합한 제공업체는 보다 지속가능한 고객 관계를 구축할 수 있습니다. 이 모델은 선택적 지원이 포함된 영구 라이선스와는 다릅니다. RAN 계획 및 최적화 소프트웨어 시장은 소프트웨어 기능을 일상적인 운영 관행에 적용해야 하는 경우, 여전히 서비스 전문 지식에 의존하고 있습니다.
2025년 시장 규모에서 온프레미스 배포는 42.15%를 차지했습니다. 통신 사업자가 데이터 주권, 운영 지원 시스템과의 긴밀한 통합, 그리고 현지 관리를 우선시하는 경우, 온프레미스 배포는 여전히 중요한 선택지가 될 것입니다. 클라우드 기반 배포는 2031년까지 연평균 19.52%의 성장률이 예상되며, 이는 모든 배포 방식 중 가장 빠른 속도입니다. 매시브 MIMO 모델링, 3D 레이 트레이싱, AI 훈련 및 국가 차원의 경로 손실 계산에는 유연한 컴퓨팅 능력이 필요합니다. Infovista사의 ‘VistaPlan Go’는 미리 조정된 전파 모델과 트래픽 분포를 활용하여 최적화된 네트워크 설계를 제공하도록 설계되었습니다. 이러한 컴퓨팅 리소스를 활용할 수 있게 되면, RAN 계획 및 최적화 소프트웨어 시장은 설계 주기 단축이라는 이점을 누릴 수 있습니다. 또한, 클라우드를 통한 제공으로 인해 현지에서의 소프트웨어 도입이나 수작업에 의한 지리 데이터 준비의 필요성도 줄어듭니다.
하이브리드 배포는 모든 데이터와 프로세스를 한 번에 이전할 수 없는 통신 사업자에게 과도기적인 대안이 됩니다. 기밀성이 높은 지리 정보는 온프레미스에 남겨둔 채, 계산 부하가 높은 시뮬레이션을 클라우드 리소스로 이전하는 것이 가능합니다. 프라이빗 5G나 정부 기관에서의 도입 시에도 데이터 보관 장소에 관한 요건이 적용되는 경우, 이 구조를 계속 활용할 수 있습니다. 하이브리드 모델을 통해 단계적인 전환이 가능해지며, 변경 관리의 위험을 줄일 수 있습니다. 또한, 통신 사업자가 클라우드 성능을 평가하는 동안에도 익숙한 워크플로우와의 연속성을 유지할 수 있습니다. RAN 계획 및 최적화 소프트웨어 업계는 하이브리드 구성을 활용함으로써, 전환 기간 중에도 기존 고객 관계를 유지할 수 있습니다. 온프레미스 도입 점유율은 감소하겠지만, 절대 수치로는 여전히 상당한 규모를 유지할 가능성이 있습니다. 전반적인 도입 구성은 온프레미스 도구를 즉시 대체하는 것이 아니라, 클라우드 기반 컴퓨팅으로 전환되고 있습니다.
지역별 분석
제공된 추정치에 따르면, 2025년 시장 규모에서 북미는 31.61%를 차지했습니다. 이 지역의 위상은 성숙한 5G 인프라와 주파수 대역에 대한 지속적인 투자를 반영하고 있습니다. AT&T는 2026년 7월, 230억 달러에 에코스타(EchoStar)의 주파수 라이선스 인수를 완료했습니다. 이 인수를 통해 미국의 거의 모든 시장에서 저대역 및 중대역 주파수 대역이 50 MHz 추가되었습니다. 새로운 주파수 대역의 도입에는 다수의 기지국에 걸친 커버리지, 간섭 및 매개변수 계획이 필요합니다. 2026년 3월까지 북미의 12개 통신 사업자가 최소 1개의 상용 5G 독립형(SA) 네트워크를 구축했습니다. 캐나다 역시 2025년에 취득한 3800 MHz 대역 주파수 라이선스에 따라 계획 주기를 이어가고 있습니다. 멕시코에서는 경쟁 및 디지털 포용 프로그램과 관련된 비교적 소규모의 현대화 기회가 예상됩니다. 남미에서는 브라질과 칠레의 통신 사업자들이 LTE 인프라를 5G 전환에 적합하도록 조정하고 있어 시장이 부상하고 있습니다.
유럽에는 성숙한 모바일 네트워크 사업자의 기반이 마련되어 있으며, Open RAN에 관한 정책 수립이 활발히 진행되고 있습니다. 주파수 대역의 조화와 연결성 목표가 지속적인 네트워크 업그레이드를 뒷받침하고 있습니다. 에릭슨은 2026년 3월, 버진 미디어 O2와의 파트너십을 5년간 연장했습니다. 이 계약은 해당 사업자의 전국 무선 네트워크 대부분을 포괄하며, AI 및 기계 학습 소프트웨어도 포함됩니다. 독일, 프랑스, 영국이 이 지역의 주요 수요 거점으로 부상하고 있습니다. 아시아태평양은 대규모 네트워크와 AI 네이티브 및 Open RAN 계획에 대한 조기 대응을 동시에 갖추고 있습니다. 중국에서는 매우 대규모의 네트워크 구성을 지원할 수 있는 도구가 요구되고 있습니다. 일본, 한국, 인도에서는 첨단 기술의 도입과 지속적인 5G 확대로 인해 수요가 증가하고 있습니다.
아프리카는 2031년까지 연평균 성장률(CAGR) 19.87%로 성장할 것으로 예측되며, 제시된 추정치 중 가장 높은 지역 성장률을 보이고 있습니다. GSMA는 2026년 말까지 아프리카의 5G 가입자 수가 1억 건 미만, 2030년까지 3억 8,000만 건을 넘어설 것으로 예측하고 있습니다. 이러한 확장에 따라 통신 사업자가 5G 기지국과 주파수 대역을 추가함에 따라 계획 수립 능력이 요구됩니다. 5G가 확산됨에 따라 레거시 기술이 계속 운영되는 지역에서는 RAN 계획 및 최적화 소프트웨어 시장에 성장 여지가 있습니다. 가나는 2026년 7월, 한 통신 사업자의 5G 독점 도매권을 취소하여 보다 경쟁력 있는 계획 환경을 조성했습니다. 중동 시장은 규모는 작지만, 사우디아라비아와 아랍에미리트(UAE)를 필두로 높은 가치를 지니고 있습니다. 스마트 시티 계획이나 도시 지역의 고밀도 구축에는 복잡한 건축 환경에 대응한 상세한 커버리지 모델링이 요구됩니다.
기타 혜택:
- 엑셀 형식의 시장 예측(ME) 시트
- 3개월간의 애널리스트 지원
자주 묻는 질문
목차
제1장 소개
- 조사 가정과 시장 정의
- 조사 범위
제2장 조사 방법
제3장 주요 요약
제4장 시장 구도
- 시장 개요
- 거시경제 요인이 시장에 미치는 영향
- 시장 성장 촉진요인
- 시장 성장 억제요인
- 업계 밸류체인 분석
- 규제 상황
- 기술 전망
- Porter's Five Forces 분석
제5장 시장 규모와 성장 예측
- 구성요소별
- 전개 방식별
- 용도별
- 최종사용자별
- 지역별
- 북미
- 미국
- 캐나다
- 멕시코
- 남미
- 브라질
- 아르헨티나
- 칠레
- 기타 남미 국가
- 유럽
- 독일
- 영국
- 프랑스
- 이탈리아
- 스페인
- 러시아
- 기타 유럽 국가
- 아시아태평양
- 중국
- 일본
- 인도
- 한국
- 호주
- 기타 아시아태평양 국가
- 중동
- 사우디아라비아
- 아랍에미리트
- 튀르키예
- 이스라엘
- 기타 중동 국가
- 아프리카
- 남아프리카공화국
- 나이지리아
- 이집트
- 기타 아프리카 국가
- 북미
제6장 경쟁 구도
- 시장 집중도
- 전략적 동향
- 시장 점유율 분석
- 기업 개요
- Telefonaktiebolaget LM Ericsson
- Nokia Corporation
- Huawei Technologies Co., Ltd.
- ZTE Corporation
- Infovista SAS
- TEOCO Corporation
- Forsk SAS
- Keysight Technologies, Inc.
- VIAVI Solutions Inc.
- Amdocs Limited
- Comarch S.A.
- Anritsu Corporation
- Ranplan Wireless Network Design Ltd.
- iBwave Solutions Inc.
- Rohde & Schwarz GmbH & Co. KG
- Samsung Electronics Co., Ltd.
- Mavenir Systems, Inc.
- RADCOM Ltd.
- Siradel SAS
- ATDI S.A.S.
- Accuver Co., Ltd.
- Ascom Holding AG
- CommScope, Inc.
제7장 시장 기회와 향후 전망
KSM 26.10.29According to Mordor Intelligence, the RAN planning and optimization software market size was valued at USD 2.76 billion in 2025 and is estimated to grow from USD 3.35 billion in 2026 to reach USD 7.65 billion by 2031, at a CAGR of 17.96% during the forecast period (2026-2031).
Global RAN Planning and Optimization Software Market Trends and Insights
5G Network Densification and Multi-Technology Complexity
5G networks are moving from broad macro coverage toward denser small-cell grids. Operators also continue to manage 2G, 3G, 4G, and 5G layers at the same time. Each site activation can alter cell-edge interference patterns and require further engineering work. The RAN Planning and Optimization Software market benefits when teams need continuous re-optimization instead of periodic network reviews. Forsk's Naos supports automated 5G site selection and country-scale path-loss calculations through service-based architecture. These capabilities are becoming important in operator requests for proposals as radio configurations become more complex.
Cloud-Native and AI-Enabled Autonomous RAN Operations
Cloud-native architecture is shifting planning tools from desktop licenses toward subscription services and application programming interfaces. This change allows software providers to update planning logic without waiting for a hardware refresh. Ericsson launched its AI in RAN software subscription in 2026 with scheduler, beamforming, positioning, and observability functions. The company stated that the package is designed to place AI functions closer to radio operations. The RAN Planning and Optimization Software market gains recurring revenue opportunities when optimization moves from batch analysis into regular network management. This model also links planning decisions more closely to operational capacity and service quality.
Operator Consolidation and Concentrated Software Buying
Operator consolidation reduces the number of organizations making independent software purchases. Merged operators can seek multi-year agreements, volume discounts, and bundled planning and optimization contracts. These requirements can reduce unit revenue for suppliers in the RAN Planning and Optimization Software market. Network tool selections may also be delayed while merged engineering teams align their technical architecture. Such evaluations can extend request-for-proposal cycles by 12 to 24 months. Suppliers with integrations across both operators' operating support systems can be better positioned when network rationalization plans are approved.
Other drivers and restraints analyzed in the detailed report include:
- Open RAN and Multi-Vendor Interoperability Requirements
- Spectrum Scarcity and Demand for Higher Spectral Efficiency
- Legacy OSS and Proprietary Tool Lock-In
For complete list of drivers and restraints, kindly check the Table Of Contents.
Segment Analysis
Software accounted for 67.98% of 2025 value and is forecast to grow at an 18.71% CAGR through 2031. The segment reflects operator demand for updated planning logic and AI functions without hardware replacement cycles. Subscription models enable suppliers to deliver new features through recurring commercial arrangements. Nokia introduced an AI-native RAN platform in 2026 that uses a software subscription model for feature delivery. This approach supports ongoing improvements to planning, radio operations, and optimization functions. It also reduces dependence on fixed-vintage tool releases that can lag network changes. The software segment of the RAN Planning and Optimization Software industry is strengthened by the need for vendor-neutral functions in mixed radio estates.
Services cover implementation, system integration, and managed operating support. They help operators configure tools when internal radio engineering resources are limited. Integration work becomes more relevant as operators add spectrum bands, technology generations, and Open RAN components. Operators in Africa and South America may need external support to integrate newer tools with existing operational support systems. Services revenue can therefore grow beside license revenue even when software remains the leading component. Providers that combine software with long-term managed services can develop more durable customer relationships. This model differs from perpetual licenses with optional support. The RAN Planning and Optimization Software market remains dependent on service expertise when software capability must be translated into routine operating practices.
On-premises deployment accounted for 42.15% of 2025 value. It remains relevant where operators prioritize data sovereignty, close operating support system integration, and local control. Cloud-based deployment is forecast to grow at 19.52% through 2031, the fastest pace among deployment modes. Massive MIMO modeling, 3D ray tracing, AI training, and country-scale path-loss calculations need flexible computing capacity. Infovista's VistaPlan Go is designed to provide optimized network designs using pre-calibrated propagation models and traffic distributions. The RAN Planning and Optimization Software market can gain from faster design cycles when such computing resources are available. Cloud delivery also reduces the need for local software deployment and manual geodata preparation.
Hybrid deployment is a transition option for operators that cannot move all data and processes at once. Sensitive geographic information may remain on premises while computationally intensive simulations move to cloud resources. Private 5G and government deployments can continue to use this structure where data residency requirements apply. A hybrid model allows a gradual migration and reduces change-management risk. It can also maintain continuity with familiar workflows while operators evaluate cloud performance. The RAN Planning and Optimization Software industry can use hybrid arrangements to preserve current customer relationships during migration. On-premises installations can remain substantial in absolute terms even as their share declines. The overall deployment mix is moving toward cloud-based computing rather than an immediate replacement of local tools.
Complete Report Scope:
- By Component
- Software
- Services
- By Deployment Mode
- On-Premises
- Cloud-Based
- Hybrid
- By Application
- RAN Planning and Design
- RAN Optimization
- Performance Management
- Capacity Planning
- Coverage and Propagation Analysis
- Interference Management
- Other Applications
- By End User
- Mobile Network Operators
- Neutral Host and Private Network Operators
- Enterprises
- Government and Public Safety Organizations
- Network Equipment Vendors and System Integrators
- By Geography
- North America
- United States
- Canada
- Mexico
- South America
- Brazil
- Argentina
- Chile
- Rest of South America
- Europe
- Germany
- United Kingdom
- France
- Italy
- Spain
- Russia
- Rest of Europe
- Asia-Pacific
- China
- Japan
- India
- South Korea
- Australia
- Rest of Asia-Pacific
- Middle East
- Saudi Arabia
- United Arab Emirates
- Turkiye
- Israel
- Rest of Middle East
- Africa
- South Africa
- Nigeria
- Egypt
- Rest of Africa
- North America
Geography Analysis
North America held 31.61% of 2025 value in the supplied estimates. The region's position reflects a mature 5G base and continued investment in spectrum. AT&T completed its acquisition of EchoStar's spectrum license in July 2026 for USD 23 billion. The acquisition added 50 MHz of low-band and mid-band spectrum across nearly all U.S. markets. New spectrum layers require coverage, interference, and parameter planning across many sites. Twelve North American operators had launched at least 1 commercial 5G standalone network by March 2026. Canada also continued a planning cycle following the 3800 MHz spectrum licenses acquired in 2025. Mexico contributes smaller modernization opportunities linked to competition and digital inclusion programs. South America is emerging as operators in Brazil and Chile adapt LTE estates for 5G migration.
Europe has a mature mobile network operator base and an active Open RAN policy setting. Spectrum harmonization and connectivity targets support continuing network upgrades. Ericsson extended its partnership with Virgin Media O2 in March 2026 for 5 years. The agreement covers most of the operator's nationwide radio network and includes AI and machine learning software. Germany, France, and the United Kingdom are major regional demand centers. Asia-Pacific combines high network scale with early work on AI-native and Open RAN planning. China requires tools that can address very large network configurations. Japan, South Korea, and India add demand through advanced technology adoption and continuing 5G expansion.
Africa is forecast to grow at a 19.87% CAGR through 2031, the fastest geographic rate in the supplied estimates. GSMA projected fewer than 100 million 5G connections in Africa by the end of 2026 and more than 380 million by 2030. This expansion requires planning capabilities as operators add 5G sites and spectrum layers. The RAN Planning and Optimization Software market has room to grow where legacy technologies remain in service during 5G rollout. Ghana removed exclusive 5G wholesale rights from one operator in July 2026, supporting a more competitive planning environment. The Middle East is smaller but high value, led by Saudi Arabia and the United Arab Emirates. Smart-city programs and dense urban deployments require detailed coverage modeling for complex built environments.
- Telefonaktiebolaget LM Ericsson
- Nokia Corporation
- Huawei Technologies Co., Ltd.
- ZTE Corporation
- Infovista SAS
- TEOCO Corporation
- Forsk SAS
- Keysight Technologies, Inc.
- VIAVI Solutions Inc.
- Amdocs Limited
- Comarch S.A.
- Anritsu Corporation
- Ranplan Wireless Network Design Ltd.
- iBwave Solutions Inc.
- Rohde & Schwarz GmbH & Co. KG
- Samsung Electronics Co., Ltd.
- Mavenir Systems, Inc.
- RADCOM Ltd.
- Siradel SAS
- ATDI S.A.S.
- Accuver Co., Ltd.
- Ascom Holding AG
- CommScope, Inc.
Additional Benefits:
- The market estimate (ME) sheet in Excel format
- 3 months of analyst support
TABLE OF CONTENTS
1 INTRODUCTION
- 1.1 Study Assumptions and Market Definition
- 1.2 Scope of the Study
2 RESEARCH METHODOLOGY
3 EXECUTIVE SUMMARY
4 MARKET LANDSCAPE
- 4.1 Market Overview
- 4.2 Impact of Macroeconomic Factors on the Market
- 4.3 Market Drivers
- 4.3.1 5G Network Densification and Multi-Technology Complexity
- 4.3.2 Spectrum Scarcity and Demand for Higher Spectral Efficiency
- 4.3.3 Cloud-Native and AI-Enabled Autonomous RAN Operations
- 4.3.4 Open RAN and Multi-Vendor Interoperability Requirements
- 4.3.5 Closed-Loop Optimization for Energy and Capacity Efficiency
- 4.3.6 Agentic AI for Governed Radio Engineering Workflows
- 4.4 Market Restraints
- 4.4.1 Operator Consolidation and Concentrated Software Buying
- 4.4.2 Legacy OSS and Proprietary Tool Lock-In
- 4.4.3 Explainability and Change-Control Risks in Autonomous Optimization
- 4.4.4 Scarcity of Calibrated Geodata and RF Engineering Talent
- 4.5 Industry Value Chain Analysis
- 4.6 Regulatory Landscape
- 4.7 Technological Outlook
- 4.7.1 5G NR, 5G Advanced, and 6G Readiness
- 4.7.2 Open RAN, vRAN, C-RAN, and RAN Intelligent Controllers
- 4.7.3 AI/ML, Digital Twins, and Predictive Optimization
- 4.7.4 Cloud-Native APIs, Containers, and RAN Planning as a Service
- 4.7.5 NTN, Private 5G, CBRS, and Shared-Spectrum Planning
- 4.8 Porter's Five Forces Analysis
- 4.8.1 Bargaining Power of Suppliers
- 4.8.2 Bargaining Power of Buyers
- 4.8.3 Threat of New Entrants
- 4.8.4 Threat of Substitutes
- 4.8.5 Competitive Rivalry
5 MARKET SIZE AND GROWTH FORECASTS (VALUE)
- 5.1 By Component
- 5.1.1 Software
- 5.1.2 Services
- 5.2 By Deployment Mode
- 5.2.1 On-Premises
- 5.2.2 Cloud-Based
- 5.2.3 Hybrid
- 5.3 By Application
- 5.3.1 RAN Planning and Design
- 5.3.2 RAN Optimization
- 5.3.3 Performance Management
- 5.3.4 Capacity Planning
- 5.3.5 Coverage and Propagation Analysis
- 5.3.6 Interference Management
- 5.3.7 Other Applications
- 5.4 By End User
- 5.4.1 Mobile Network Operators
- 5.4.2 Neutral Host and Private Network Operators
- 5.4.3 Enterprises
- 5.4.4 Government and Public Safety Organizations
- 5.4.5 Network Equipment Vendors and System Integrators
- 5.5 By Geography
- 5.5.1 North America
- 5.5.1.1 United States
- 5.5.1.2 Canada
- 5.5.1.3 Mexico
- 5.5.2 South America
- 5.5.2.1 Brazil
- 5.5.2.2 Argentina
- 5.5.2.3 Chile
- 5.5.2.4 Rest of South America
- 5.5.3 Europe
- 5.5.3.1 Germany
- 5.5.3.2 United Kingdom
- 5.5.3.3 France
- 5.5.3.4 Italy
- 5.5.3.5 Spain
- 5.5.3.6 Russia
- 5.5.3.7 Rest of Europe
- 5.5.4 Asia-Pacific
- 5.5.4.1 China
- 5.5.4.2 Japan
- 5.5.4.3 India
- 5.5.4.4 South Korea
- 5.5.4.5 Australia
- 5.5.4.6 Rest of Asia-Pacific
- 5.5.5 Middle East
- 5.5.5.1 Saudi Arabia
- 5.5.5.2 United Arab Emirates
- 5.5.5.3 Turkiye
- 5.5.5.4 Israel
- 5.5.5.5 Rest of Middle East
- 5.5.6 Africa
- 5.5.6.1 South Africa
- 5.5.6.2 Nigeria
- 5.5.6.3 Egypt
- 5.5.6.4 Rest of Africa
- 5.5.1 North America
6 COMPETITIVE LANDSCAPE
- 6.1 Market Concentration
- 6.2 Strategic Moves
- 6.3 Market Share Analysis
- 6.4 Company Profiles (includes Global Level Overview, Market Level Overview, Core Segments, Financials as available, Strategic Information, Market Rank/Share, Products and Services, Recent Developments)
- 6.4.1 Telefonaktiebolaget LM Ericsson
- 6.4.2 Nokia Corporation
- 6.4.3 Huawei Technologies Co., Ltd.
- 6.4.4 ZTE Corporation
- 6.4.5 Infovista SAS
- 6.4.6 TEOCO Corporation
- 6.4.7 Forsk SAS
- 6.4.8 Keysight Technologies, Inc.
- 6.4.9 VIAVI Solutions Inc.
- 6.4.10 Amdocs Limited
- 6.4.11 Comarch S.A.
- 6.4.12 Anritsu Corporation
- 6.4.13 Ranplan Wireless Network Design Ltd.
- 6.4.14 iBwave Solutions Inc.
- 6.4.15 Rohde & Schwarz GmbH & Co. KG
- 6.4.16 Samsung Electronics Co., Ltd.
- 6.4.17 Mavenir Systems, Inc.
- 6.4.18 RADCOM Ltd.
- 6.4.19 Siradel SAS
- 6.4.20 ATDI S.A.S.
- 6.4.21 Accuver Co., Ltd.
- 6.4.22 Ascom Holding AG
- 6.4.23 CommScope, Inc.
7 MARKET OPPORTUNITIES AND FUTURE OUTLOOK
- 7.1 White-Space and Unmet-Need Assessment


