
|
시장보고서
상품코드
2063889
영국의 전기자동차 충전 설비 시장 : 시장 점유율 분석, 업계 동향 및 통계, 성장 예측(2026-2031년)United Kingdom Electric Vehicle Charging Equipment - Market Share Analysis, Industry Trends & Statistics, Growth Forecasts (2026 - 2031) |
||||||
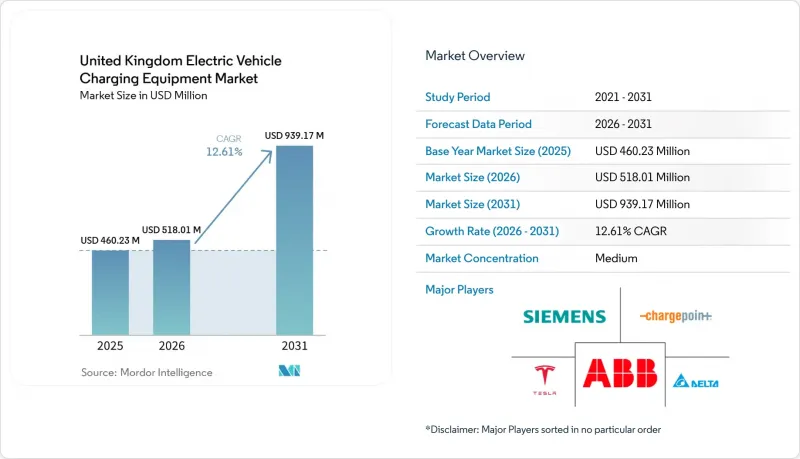
Mordor Intelligence에 의하면, 영국의 전기자동차 충전 설비 시장 규모는 2025년 4억 6,023만 달러로 평가되었고, 2026년에는 5억 1,801만 달러로 추정되고, 2026-2031년 CAGR 12.61%로 성장을 지속할 전망이며, 2031년까지 9억 3,917만 달러에 이를 것으로 예측됩니다.

본 보고서는 충전 수준별(레벨 1, 레벨 2, DC 급속 충전, 초급속 충전, 메가와트급), 설치 장소별(주택, 상업·소매 시설, 공공·지자체 시설, 교통 허브), 용도별(가정, 직장, 도시 공공 구역, 고속도로 연선·이동 중, 차량 함대 및 차고)로 분류되어 있습니다. 시장 규모 및 전망은 금액(달러) 기준으로 제시되어 있습니다.
영국의 전기자동차 충전 설비 시장 동향 및 인사이트
전기자동차 보급 및 ZEV 의무화 일정
제로 배출 차량(ZEV) 판매 의무에 따라, 2025년까지 신차의 28%, 2030년까지 80%를 제로 에미션 차량으로 할 것을 요구하고 있으며, 배터리식 전기자동차 보급률이 1% 상승할 때마다 과거 실적을 보면 18개월 이내에 공공 충전소가 1.4배로 급증하기 때문에 인프라 수요가 높아지고 있습니다. 자동차 제조업체들은 기준을 충족하지 못하는 차량 1대당 1만 5,000파운드의 벌금을 물게 되며, 이로 인해 신차 판매 시 가정용 충전기를 세트로 판매하는 것이 촉진되고 있습니다. 스코틀랜드가 먼저 제시한 2030년 단계적 폐지 목표에 따라, 2024년 ChargePlace 설치 건수는 전년 대비 22% 증가했습니다. 이러한 의무화 조치에 따른 플렉스 크레딧 제도를 통해 제조업체는 잉여 ZEV 판매분을 누적할 수 있기 때문에 연간 설치 대수에서 불균형적인 급증 현상이 나타나고 있습니다. 이에 따라 각 제조업체는 충전소 사업자와 협력하여 차량 인도 대수에 맞추어 용량을 확대함으로써, 공급망 수요 피크를 평준화하고 있습니다.
OZEV에 대한 보조금 및 세제 혜택
제로 배출 차량국(OZEV)은 주택용 충전소 1기당 최대 350파운드를 지원하며, 직장용 충전기 비용에 대해서는 상한 1만 5,000파운드까지 75%를 보조하고 있습니다. 이에 따라 2024년에는 업무용 하드웨어의 투자 회수 기간이 4.2년에서 2.8년으로 단축되었습니다. 회사 차량에 대한 현물 급여 세율은 2025년까지 배터리식 전기자동차(BEV)에 대해 2%로 유지되며, 이는 작년 신규 전기자동차 등록 대수의 54%를 차지한 기업 수요를 뒷받침하고 있습니다. 그러나 이 보조금은 사유 도로를 보유한 단독주택 소유자를 지원 대상에서 제외하고 있어, 공적 자금이 공동주택에 집중되는 결과로 도시와 지방 간의 격차를 확대시키고 있습니다. 급여 공제 제도는 경제성을 한층 더 높여주며, 고용주는 차량 1대당 연간 약 4,800파운드를 절약할 수 있습니다. 이러한 인센티브들이 맞물려 도입을 가속화하는 한편, 도입은 인구 밀도가 높은 지역에 편중되는 경향을 보이고 있습니다.
높은 설치 비용과 계통 연계 비용
도시 지역에 급속 충전기를 설치하는 데 드는 비용은 4만-8만 파운드에 달할 전망입니다. 이는 예산의 50-60%가 전력망 개보수 비용으로 쓰이기 때문입니다. 초고속 충전기의 경우, 전용 11kV 급전선이나 배전 사업자(DNO)가 의무화하는 변압기가 필요하기 때문에 비용은 18만 파운드까지 치솟습니다. 토목 공사비는 1만 5,000-4만 파운드가 추가되지만, 웨스트민스터와 같은 역사적인 중심가에서는 매설된 배관이 밀집해 있어 도랑 파기 작업이 복잡해집니다. 주택용 유닛은 800-1,500파운드이지만, 공동주택에는 3,000-8,000파운드의 부하 관리 시스템이 필요하며, 이에 따른 전력 절감 효과는 제한적입니다. 이러한 경제적 요인으로 인해 교통량이 적은 지역에 대한 민간 투자는 위축되고, 이용률이 높은 고속도로 연선에 시설이 집중되는 경향이 있습니다.
부문별 분석
350kW를 초과하는 메가와트급 충전기는 ZEHID 프로그램이 대형 차량 차고지 및 고속도로 허브에 자금을 지원함으로써 500kWh 트럭이 30분 이내에 충전할 수 있게 됨에 따라, 2031년까지 연평균 성장률(CAGR) 24.9%로 성장할 전망입니다. 2025년 도입 대수의 51.30%를 레벨 2 충전기가 차지하고 있으며, 이는 ‘Intelligent Octopus Go’ 프로그램을 통해 야간 요금 7펜스를 이용하는 120만 대의 가정용 충전기가 주도하고 있습니다. 50kW에서 150kW급 DC 급속 충전 장치는 고속도로 휴게소에서 주류를 이루고 있으며, 처리 능력과 설치 비용의 균형을 맞추면서 주요 설치 장소에서는 하루 20회 이상의 이용 횟수를 기록하고 있습니다. 초고속 충전기는 테슬라와 아이오니티가 장거리 회랑의 거점으로 삼고 있는 M25 및 M6 고속도로를 따라 밀집해 있습니다. 레벨 1 충전 소켓은 충전 시간이 12시간이나 걸려 현대의 60kWh 배터리 팩을 지원하지 못하기 때문에 신규 설치 건수의 2% 미만에 그치고 있습니다.
3C 충전 속도를 지원하는 배터리 화학 성분 덕분에 고출력 충전의 보급이 촉진되고 있습니다. 또한, 2024년부터는 공공 입찰에서 IEC 61851 준수가 의무화됨에 따라 기존 사업자들의 설비 교체 주기가 가속화되고 있습니다. 레벨 2 충전의 향후 성장은 LEVI의 자금 지원을 통한 가로등 개조에 달려 있습니다. 이로써, 가구의 40%가 전용 주차장을 갖추지 않은 공동주택 단지에 5.5kW 규모의 충전 설비가 제공되게 됩니다. 모듈식 파워 스택 설계를 통해 사업자는 가동률이 상승함에 따라 캐비닛을 전면 교체하지 않고도 75kW에서 150kW로 업그레이드할 수 있어 투자 수익률(ROI)을 확보할 수 있습니다. 초고속 충전 허브는 20분간의 체류 시간을 수익으로 전환하는 소매 파트너를 늘려주며, 1회 이용당 4-6파운드의 부가 수익을 창출합니다. 이러한 동향들이 복합적으로 작용하여, 영국의 전기자동차 충전 설비 시장에서 다층적인 전력 포트폴리오가 유지되고 있습니다.
기타 혜택 :
- 엑셀 형식 시장 예측(ME) 시트
- 3개월간의 애널리스트 지원
자주 묻는 질문
목차
제1장 서론
제2장 조사 방법
제3장 주요 요약
제4장 시장 구도
제5장 시장 규모 및 성장 예측
제6장 경쟁 구도
제7장 시장 기회 및 향후 전망
AJY 26.06.26According to Mordor Intelligence, the united kingdom electric vehicle charging equipment market size is expected to grow from USD 460.23 million in 2025 to USD 518.01 million in 2026 and is forecast to reach USD 939.17 million by 2031 at 12.61% CAGR over 2026-2031.
This report is Segmented by Charging Level (Level 1, Level 2, DC Fast, Ultra-Fast, and Megawatt Class), Installation Site (Residential, Commercial and Retail, Public Municipal, and Transportation Hubs), and Application (Home, Workplace, Public Urban, Highway Corridor/En-Route, and Fleet and Depot). The Market Sizes and Forecasts are Provided in Terms of Value (USD).
United Kingdom Electric Vehicle Charging Equipment Market Trends and Insights
EV Adoption and ZEV Mandate Timelines
The Zero Emission Vehicle sales mandate requires 28% of new cars to be zero-emission by 2025, and 80% by 2030, escalating infrastructure demand as every percentage point rise in battery-electric penetration historically drives a 1.4-fold jump in public chargepoints within 18 months . Automakers face GBP 15,000 fines per non-compliant vehicle, prompting bundled home-charger offers with new EV sales. Scotland's earlier 2030 phase-out target triggered a 22% annual rise in ChargePlace installations in 2024. The mandate's flex-credit mechanism lets manufacturers bank surplus ZEV sales, creating uneven yearly installation spikes. Manufacturers, therefore, collaborate with charge-point operators to ensure capacity scales with vehicle deliveries, smoothing supply chain peaks .
OZEV Grants and Tax Incentives
The Office for Zero Emission Vehicles offers up to GBP 350 per residential chargepoint and covers 75% of workplace-charger costs to GBP 15,000, cutting the payback period on workplace hardware from 4.2 years to 2.8 years in 2024. Company-car benefit-in-kind rates remain at 2% for battery electrics through 2025, boosting corporate demand that comprised 54% of new EV registrations last year. Yet the grant excludes detached-home owners with private driveways, concentrating public funds in multi-unit dwellings and widening a rural-urban gap. Salary-sacrifice schemes further tip economics, saving employers nearly GBP 4,800 annually per vehicle. Combined, these incentives accelerate uptake but skew deployment toward high-density postcodes.
High Installation and Grid-Connection CAPEX
Rapid chargers cost GBP 40,000-80,000 installed in urban zones because grid upgrades absorb 50%-60% of budgets. Ultra-fast units climb to GBP 180,000 due to dedicated 11 kV feeds and DNO-mandated transformers . Civil works add GBP 15,000-40,000, where congested utilities complicate trenching in historic centers such as Westminster. Residential units cost GBP 800-1,500, but multi-unit dwellings need GBP 3,000-8,000 load-management systems that grant only partial offset. These economics deter private investment in lower-traffic areas, skewing installations toward motorway corridors with higher utilization.
Other drivers and restraints analyzed in the detailed report include:
- Public-Sector Funding (LEVI and Rapid Charging Fund)
- Corporate Fleet Electrification Targets
- Power-Electronics Supply-Chain Constraints
For complete list of drivers and restraints, kindly check the Table Of Contents.
Segment Analysis
Megawatt-class chargers exceeding 350 kW will expand at a 24.9% CAGR through 2031 as the ZEHID program funds heavy-duty depots and motorway hubs, enabling 500 kWh trucks to recharge in under 30 minutes. Level 2 hardware accounted for 51.30% of 2025 deployments, driven by 1.2 million home units utilizing 7 pence night rates under Intelligent Octopus Go. DC fast units between 50 kW and 150 kW dominate motorway services, balancing throughput with connection costs and hitting 20-plus daily sessions at prime sites. Ultra-fast chargers cluster along the M25 and M6 where Tesla and Ionity anchor long-distance corridors. Level 1 sockets now account for under 2% of new installs because 12-hour charge times cannot match modern 60 kWh packs.
Battery chemistries accepting 3C charge rates promote higher-power adoption, and IEC 61851 compliance became mandatory in public tenders during 2024, driving refresh cycles among incumbents. Level 2's future growth depends on LEVI-funded lamppost conversions delivering 5.5 kW to apartment streets where 40% of households lack driveways. Modular power-stack designs let operators upgrade 75 kW cabinets to 150 kW as utilization rises without full replacement, protecting ROI. Ultra-fast hubs add retail partners that monetize 20-minute dwell times, earning GBP 4-6 ancillary spend per session. Together, these dynamics sustain a layered power portfolio within the United Kingdom electric vehicle charging equipment market.
List of Companies Covered in this Report:
- BP Pulse (BP plc)
- Pod Point Group Holdings plc
- InstaVolt Ltd
- Shell Recharge Solutions (Shell plc)
- Osprey Charging Network Ltd
- Gridserve Sustainable Energy Ltd
- Tesla Inc.
- ABB Ltd
- Siemens AG
- ChargePoint Holdings Inc.
- Schneider Electric SE
- Eaton Corporation plc
- Delta Electronics Inc.
- EO Charging
- Rolec Services Ltd
- Wallbox NV
- Robert Bosch GmbH
- Alfen NV
- Fastned BV
- Zaptec ASA
Additional Benefits:
- The market estimate (ME) sheet in Excel format
- 3 months of analyst support
TABLE OF CONTENTS
1 Introduction
- 1.1 Study Assumptions & Market Definition
- 1.2 Scope of the Study
2 Research Methodology
3 Executive Summary
4 Market Landscape
- 4.1 Market Overview
- 4.2 Market Drivers
- 4.2.1 EV adoption & ZEV mandate timelines
- 4.2.2 OZEV grants & tax incentives
- 4.2.3 Public-sector funding (LEVI & Rapid Charging Fund)
- 4.2.4 Corporate fleet electrification targets
- 4.2.5 Dynamic tariffs enabling profitable smart charging
- 4.2.6 Second-life batteries integrated with chargers
- 4.3 Market Restraints
- 4.3.1 High installation & grid-connection CAPEX
- 4.3.2 Power-electronics supply-chain constraints
- 4.3.3 DNO queue delays at urban substations
- 4.3.4 Payment-system interoperability gaps
- 4.4 Supply-Chain Analysis
- 4.5 Regulatory Landscape
- 4.6 Technological Outlook
- 4.7 Porter's Five Forces
- 4.7.1 Threat of New Entrants
- 4.7.2 Bargaining Power of Suppliers
- 4.7.3 Bargaining Power of Buyers
- 4.7.4 Threat of Substitutes
- 4.7.5 Competitive Rivalry
- 4.8 PESTLE Analysis
- 4.9 Investment Analysis
5 Market Size & Growth Forecasts
- 5.1 By Charging Level
- 5.1.1 Level 1 (Up to 3 kW)
- 5.1.2 Level 2 (3 to 50 kW)
- 5.1.3 DC Fast (50 to 150 kW)
- 5.1.4 Ultra-Fast (150 to 350 kW)
- 5.1.5 Megawatt Class (Above 350 kW)
- 5.2 By Installation Site
- 5.2.1 Residential
- 5.2.2 Commercial and Retail
- 5.2.3 Public Municipal
- 5.2.4 Transportation Hubs (Airports, Ports)
- 5.3 By Application
- 5.3.1 Home Charging
- 5.3.2 Workplace Charging
- 5.3.3 Public Urban Charging
- 5.3.4 Highway Corridor/En-Route Fast Charging
- 5.3.5 Fleet and Depot Charging
6 Competitive Landscape
- 6.1 Market Concentration
- 6.2 Strategic Moves (M&A, Partnerships, PPAs)
- 6.3 Market Share Analysis (Market Rank/Share for key companies)
- 6.4 Company Profiles (includes Global level Overview, Market level overview, Core Segments, Financials as available, Strategic Information, Products & Services, and Recent Developments)
- 6.4.1 BP Pulse (BP plc)
- 6.4.2 Pod Point Group Holdings plc
- 6.4.3 InstaVolt Ltd
- 6.4.4 Shell Recharge Solutions (Shell plc)
- 6.4.5 Osprey Charging Network Ltd
- 6.4.6 Gridserve Sustainable Energy Ltd
- 6.4.7 Tesla Inc.
- 6.4.8 ABB Ltd
- 6.4.9 Siemens AG
- 6.4.10 ChargePoint Holdings Inc.
- 6.4.11 Schneider Electric SE
- 6.4.12 Eaton Corporation plc
- 6.4.13 Delta Electronics Inc.
- 6.4.14 EO Charging
- 6.4.15 Rolec Services Ltd
- 6.4.16 Wallbox NV
- 6.4.17 Robert Bosch GmbH
- 6.4.18 Alfen NV
- 6.4.19 Fastned BV
- 6.4.20 Zaptec ASA
7 Market Opportunities & Future Outlook
- 7.1 White-space & Unmet-need Assessment
