
|
시장보고서
상품코드
2066775
유럽의 전기자동차 충전 설비 : 시장 점유율 분석, 업계 동향 및 통계, 성장 예측(2026-2031년)Europe Electric Vehicle (EV) Charging Equipment - Market Share Analysis, Industry Trends & Statistics, Growth Forecasts (2026 - 2031) |
||||||
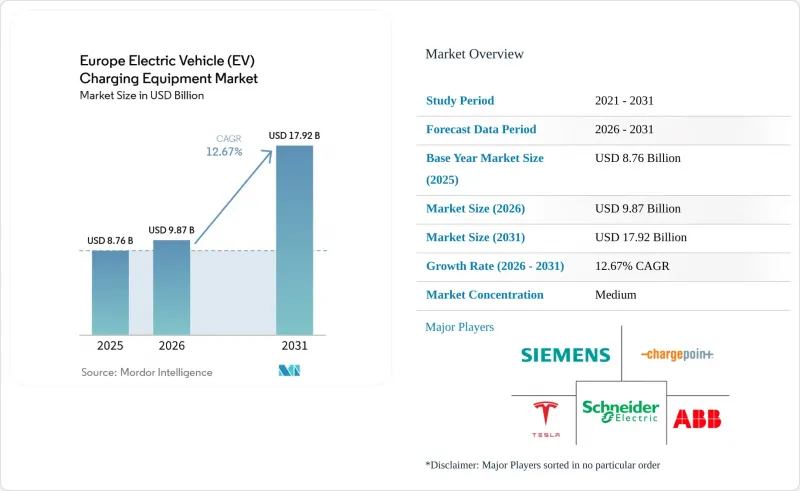
Mordor Intelligence에 의하면, 2026년 유럽의 전기자동차 충전 설비 시장 규모는 98억 7,000만 달러에 달할 것으로 예상됩니다. 2025년 87억 6,000만 달러에서 확대해, 2031년에는 179억 2,000만 달러에 이를 것으로 예측됩니다.
2026년부터 2031년까지의 연평균 성장률(CAGR)은 12.67%를 나타낼 것으로 전망됩니다.

본 보고서는 충전 수준(레벨 1, 레벨 2, DC 급속 충전, 초급속 충전, 메가와트급), 설치 장소(주거, 상업·소매 시설, 공공시설, 교통 허브), 용도(가정, 직장, 도시 공공, 고속도로 연선/이동 중, 차량·정비 거점), 그리고 지역(독일, 영국, 프랑스, 스페인, 네덜란드, 노르웨이 등)별로 분류되어 있습니다.
유럽의 전기자동차 충전 설비 시장 동향 및 인사이트
전기자동차 보급 확대 및 관련 투자
2024년 배터리식 전기자동차의 신규 등록 대수는 320만 대에 달했으며, 유럽자동차산업협회(ACEA)는 2030년까지 5,000만 대 이상의 전기자동차가 도로를 달릴 것으로 전망하고 있습니다. 각 자동차 제조업체들은 현재 제품 전략에 고출력 충전 인프라에 대한 투자를 포함시키고 있습니다. IONITY 컨소시엄만 해도 2024년에 7억 유로의 자금을 확보하여, 정격 출력 350kW의 충전기를 7,000대로 증설했습니다. 차량 대수가 증가하면 충전기의 이용률이 높아지며, 이에 따라 장비 공급업체의 수익 안정성이 향상됩니다. 차량 구매자는 소비자 대상 보조금이 아닌 주요 노선망의 커버리지를 기준으로 조달을 진행하기 때문에 하드웨어에 대한 장기적인 수요가 안정적입니다.
정부 주도의 공공 충전 네트워크 확대
가맹국들은 2024-2030년간 공공 충전 인프라 구축에 100억 유로 이상을 배정하고 있으며, 그 선두에는 독일의 55억 유로 규모 ‘Deutschlandnetz’ 프로그램과 프랑스의 고속도로 회랑에 대한 19억 유로 재투자가 있습니다. 입찰 지침에는 최소 출력 및 상호 운용성에 관한 요건이 명시되어 있기 때문에 공급업체들은 인증된 계측 기능과 원격 업데이트 기능을 중시하고 있습니다. 경쟁 입찰로 인해 이익률은 압박을 받지만, 다년 계약을 통해 대량 도입에 따른 규모의 경제 효과가 가격 압박의 일부를 상쇄하고 있습니다.
높은 설치 및 계통 연계 비용
150kW 급속 충전기 1대를 도입하는 데는 최대 30만 유로의 비용이 소요되며, 그 총액의 절반 가까이를 계통 연계 비용이 차지할 수도 있습니다. 지방의 설치 장소에서는 킬로미터 단위의 배선이나 새로운 변압기가 필요한 경우가 많으며, 이로 인해 손익분기점이 되는 가동률이 상승합니다. 이러한 장벽을 완화하기 위해 공급업체들은 여러 대의 50kW 충전기에 전력을 공급하는 모듈식 캐비닛을 도입하고 있으며, 피크 시간대의 충전 속도를 다소 희생함으로써 계통 연계 비용을 절감하고자 하고 있습니다.
부문별 분석
350kW를 초과하는 메가와트급 유닛은 디젤 차량과 동등한 30분 미만의 충전 시간을 의무화하는 트럭 전기화 규제의 뒷바람을 타고 연평균 성장률(CAGR) 23.88%를 나타낼 것으로 전망됩니다. Milence사는 2024년에 안트베르펜-브뤼헤에 최초의 상용 1MW 시스템을 설치하여 기술적 실현 가능성을 입증했습니다. 2025년, 레벨 2 충전 설비는 유럽의 전기자동차 충전 설비 시장 전반에 걸친 광범위한 주거 및 직장 기반 덕분에 46.85%의 점유율을 유지했습니다. 플릿 사업자와 고속도로 운영 사업자들이 초고속 충전 기술로 직접 전환하는 가운데, 중출력 DC 하드웨어를 전문으로 하는 공급업체들은 압박을 느끼고 있습니다. 유럽의 전기자동차 충전 설비 시장에서 레벨 2 시장 규모는 여전히 크지만, 성장률은 고출력 부문에 유리하게 작용하고 있습니다.
국내 AC 전문 제조업체들은 이에 발맞추어 전략을 전환하고 있습니다. 알펜사는 2025년 초 중출력 DC 제조 사업에서 철수하고 대량 생산형 AC 제품 라인에 주력하는 한편, 지멘스사는 E.ON사와의 제휴를 통해 300kW 플랫폼을 확충했습니다. 사업자들은 하드웨어, 소프트웨어, 유지보수를 하나의 패키지로 제공할 수 있는 공급업체를 선호하는 경향이 있으며, 이는 수직 통합형 서비스를 제공하는 기업에 유리하게 작용합니다. 메가와트급 시스템의 도입이 가속화될 것으로 예상에 따라, 유럽의 전기자동차 충전 설비 시장에서 고출력 시스템의 점유율은 현재 한 자릿수에서 향후 10년 말에는 20%대 초반까지 상승할 전망입니다.
기타 혜택 :
- 엑셀 형식 시장 예측(ME) 시트
- 3개월간의 애널리스트 지원
자주 묻는 질문
목차
제1장 서론
제2장 조사 방법
제3장 주요 요약
제4장 시장 구도
제5장 시장 규모 및 성장 예측
제6장 경쟁 구도
제7장 시장 기회 및 향후 전망
KTH 26.06.29According to Mordor Intelligence, the europe electric vehicle charging equipment market size in 2026 is estimated at USD 9.87 billion, growing from 2025 value of USD 8.76 billion with 2031 projections showing USD 17.92 billion, growing at 12.67% CAGR over 2026-2031.
This report is Segmented by Charging Level (Level 1, Level 2, DC Fast, Ultra-Fast, and Megawatt Class), Installation Site (Residential, Commercial and Retail, Public Municipal, and Transportation Hubs), Application (Home, Workplace, Public Urban, Highway Corridor/En-Route, and Fleet and Depot), and Geography (Germany, United Kingdom, France, Spain, Netherlands, Norway, and More).
Europe Electric Vehicle (EV) Charging Equipment Market Trends and Insights
Growing Adoption of EVs and Related Investments
Battery-electric vehicle registrations reached 3.2 million units in 2024, and the European Automobile Manufacturers' Association projects a fleet of more than 50 million EVs on the road by 2030. Automakers now embed high-power charging investments into product strategies; the IONITY consortium alone secured EUR 700 million in 2024 to grow its network to 7,000 chargers rated at 350 kW. Higher vehicle volumes raise charger utilization, which improves revenue certainty for equipment suppliers. Fleet buyers base procurement on corridor coverage rather than consumer subsidies, stabilizing long-term hardware demand.
Government-Backed Expansion of Public-Charging Networks
Member states have allocated more than EUR 10 billion for public-charging deployments between 2024 and 2030, led by Germany's EUR 5.5 billion Deutschlandnetz program and France's EUR 1.9 billion reinvestment in highway corridors. Tender frameworks specify minimum power outputs and interoperability features, so hardware vendors emphasize certified metering and remote-update capability. Competitive bidding squeezes margins, but multi-year contracts offset price pressure through volume scale.
High Installation and Grid-Connection Costs
Deploying a 150 kW fast charger can cost up to EUR 300,000, with grid fees comprising as much as half of the total. Rural sites often need kilometer-scale cabling and new transformers, which escalates break-even utilization levels. To ease barriers, suppliers promote modular cabinets that feed several 50 kW dispensers, trading peak speed for lower connection charges.
Other drivers and restraints analyzed in the detailed report include:
- EU AFIR Fast-Charger Mandate
- Grid-Balancing Revenue Streams Unlocking Charger ROI
- Distribution-Grid Congestion and Transformer Delays
For complete list of drivers and restraints, kindly check the Table Of Contents.
Segment Analysis
Megawatt units above 350 kW are poised for a 23.88% CAGR, buoyed by truck electrification mandates that call for sub-30-minute refueling parity with diesel. Milence installed the first commercial 1 MW system at Antwerp-Bruges in 2024, demonstrating technical feasibility. Level 2 equipment retained a 46.85% share in 2025, thanks to the vast residential and workplace base across the European electric vehicle charging equipment market. Vendors that specialize in mid-range DC hardware feel pressure as fleet operators and highway concessionaires leapfrog directly to ultra-fast technology. The European electric vehicle charging equipment market size for Level 2 remains significant, yet growth rates favor higher power segments.
Domestic AC specialists shift their strategy accordingly. Alfen exited mid-range DC manufacturing in early 2025 to focus on high-volume AC lines, while Siemens broadened its 300-kW platform through a partnership with E.ON. Operators prefer suppliers able to bundle hardware, software, and maintenance, which favors companies with vertically integrated offerings. The expected acceleration in megawatt deployments should raise the European electric vehicle charging equipment market share of high-power systems from today's single-digit baseline toward the low-twenties by decade-end.
List of Companies Covered in this Report:
- ABB Ltd
- Schneider Electric SE
- Siemens AG
- Tesla Inc.
- ChargePoint Holdings Inc.
- Delta Electronics Inc.
- Robert Bosch GmbH
- EVBox Group
- Alfen N.V.
- Power Electronics S.L.
- Wallbox N.V.
- Kempower Oyj
- IONITY GmbH
- Fastned B.V.
- Enel X Way S.p.A.
- BP Pulse (BP p.l.c.)
- Shell Recharge (Shell p.l.c.)
- E.ON Drive GmbH
- Allego N.V.
- Eaton Corporation plc
Additional Benefits:
- The market estimate (ME) sheet in Excel format
- 3 months of analyst support
TABLE OF CONTENTS
1 Introduction
- 1.1 Study Assumptions & Market Definition
- 1.2 Scope of the Study
2 Research Methodology
3 Executive Summary
4 Market Landscape
- 4.1 Market Overview
- 4.2 Market Drivers
- 4.2.1 Growing adoption of EVs & related investments
- 4.2.2 Government-backed expansion of public-charging networks
- 4.2.3 EU AFIR mandate for ?60 km fast-charger spacing on TEN-T corridors (2025)
- 4.2.4 Grid-balancing revenue streams (V2G & dynamic tariffs) unlocking charger ROI
- 4.2.5 Retail-energy players bundling home-solar + EV chargers
- 4.3 Market Restraints
- 4.3.1 High installation & grid-connection costs
- 4.3.2 Distribution-grid congestion & transformer upgrade delays
- 4.3.3 Fragmented payments/roaming standards outside AFIR scope
- 4.3.4 Rising electricity prices squeezing charger-operator margins
- 4.4 Supply-Chain Analysis
- 4.5 Regulatory Landscape
- 4.6 Technological Outlook
- 4.7 Porter's Five Forces
- 4.7.1 Bargaining Power of Suppliers
- 4.7.2 Bargaining Power of Consumers
- 4.7.3 Threat of New Entrants
- 4.7.4 Threat of Substitute Products & Services
- 4.7.5 Intensity of Competitive Rivalry
5 Market Size & Growth Forecasts
- 5.1 By Charging Level
- 5.1.1 Level 1 (Up to 3 kW)
- 5.1.2 Level 2 (3 to 50 kW)
- 5.1.3 DC Fast (50 to 150 kW)
- 5.1.4 Ultra-Fast (150 to 350 kW)
- 5.1.5 Megawatt Class (Above 350 kW)
- 5.2 By Installation Site
- 5.2.1 Residential
- 5.2.2 Commercial and Retail
- 5.2.3 Public Municipal
- 5.2.4 Transportation Hubs (Airports, Ports)
- 5.3 By Application
- 5.3.1 Home Charging
- 5.3.2 Workplace Charging
- 5.3.3 Public Urban Charging
- 5.3.4 Highway Corridor/En-Route Fast Charging
- 5.3.5 Fleet and Depot Charging
- 5.4 By Geography
- 5.4.1 Germany
- 5.4.2 United Kingdom
- 5.4.3 France
- 5.4.4 Italy
- 5.4.5 Spain
- 5.4.6 Netherlands
- 5.4.7 Norway
- 5.4.8 Russia
- 5.4.9 Rest of Europe
6 Competitive Landscape
- 6.1 Market Concentration
- 6.2 Strategic Moves (M&A, Partnerships, PPAs)
- 6.3 Market Share Analysis (Market Rank/Share for key companies)
- 6.4 Company Profiles (includes Global level Overview, Market level overview, Core Segments, Financials as available, Strategic Information, Products & Services, and Recent Developments)
- 6.4.1 ABB Ltd
- 6.4.2 Schneider Electric SE
- 6.4.3 Siemens AG
- 6.4.4 Tesla Inc.
- 6.4.5 ChargePoint Holdings Inc.
- 6.4.6 Delta Electronics Inc.
- 6.4.7 Robert Bosch GmbH
- 6.4.8 EVBox Group
- 6.4.9 Alfen N.V.
- 6.4.10 Power Electronics S.L.
- 6.4.11 Wallbox N.V.
- 6.4.12 Kempower Oyj
- 6.4.13 IONITY GmbH
- 6.4.14 Fastned B.V.
- 6.4.15 Enel X Way S.p.A.
- 6.4.16 BP Pulse (BP p.l.c.)
- 6.4.17 Shell Recharge (Shell p.l.c.)
- 6.4.18 E.ON Drive GmbH
- 6.4.19 Allego N.V.
- 6.4.20 Eaton Corporation plc
7 Market Opportunities & Future Outlook
- 7.1 White-space & Unmet-need Assessment

