

|
시장보고서
상품코드
2119122
몰입형 마케팅 서비스 : 시장 점유율 분석, 업계 동향 및 통계, 성장 예측(2026-2031년)Immersive Marketing Services - Market Share Analysis, Industry Trends & Statistics, Growth Forecasts (2026 - 2031) |
||||||
 Mordor Intelligence
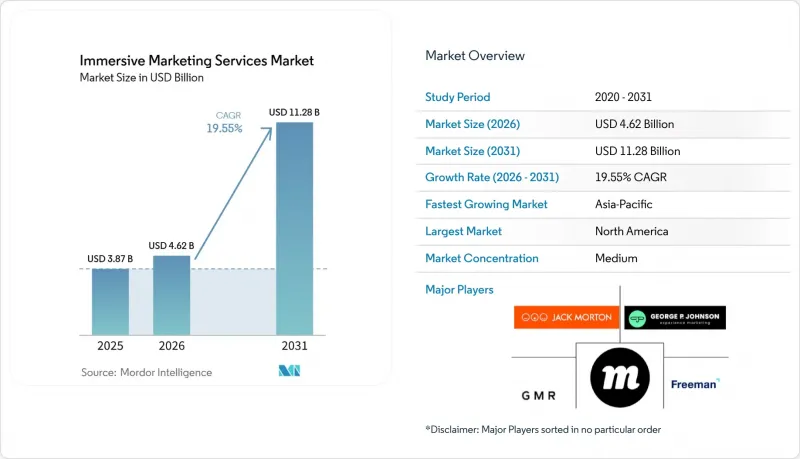
Mordor Intelligence에 의하면, 몰입형 마케팅 서비스 시장 규모는 2025년 38억 7,000만 달러로 평가되었습니다. 2026년 46억 2,000만 달러에서 2031년까지 112억 8,000만 달러로 확대되며 2026년부터 2031년까지 CAGR은 19.55%를 나타낼 전망입니다.
본 보고서는 용도별(가상 상거래 및 착용 체험, 제품 발표·시연, 소셜 미디어 및 크리에이터 캠페인 등), 최종 이용 산업별(소매 및 전자상거래, 자동차, 미디어 및 엔터테인먼트, 여행·호텔업, 부동산, 헬스케어,스포츠 및 피트니스 등) 및 지역별로 분류되어 있습니다. 시장 전망은 금액(달러) 기준으로 제시되어 있습니다.
세계의 몰입형 마케팅 서비스 시장 동향 및 인사이트
참여형 브랜드 참여에 대한 수요 증가
광고주들이 능동적인 브랜드 참여를 모색함에 따라 몰입형 마케팅 서비스 시장은 그 혜택을 누리고 있습니다. SugarXR의 보고서에 따르면, AR 및 3D 콘텐츠를 갖춘 제품은 이를 갖추지 않은 제품에 비해 전환율이 94% 더 높았으며, AR의 평균 체류 시간은 동영상 참여 시간의 4배에 달했다고 합니다. IAB 보고서에 따르면, 미국 광고 구매자의 41%가 2026년에 대면 및 체험형 광고에 대한 지출을 늘릴 것으로 예측됩니다. Kantar사는 2025년에 스폰서십 이벤트가 가장 빠르게 성장하는 유료 채널로 부상했으며, 마케터의 22%가 예산 배분을 해당 분야로 전환하고 있다고 지적했습니다. 또한, 참여형 접근 방식을 통해 브랜드는 상호작용이 발생하는 순간에 퍼스트파티 행동 신호를 수집할 수 있게 됩니다. 이 기능은 브라우저 및 모바일 환경 전반에서 써드파티 신호가 감소함에 따라 그 가치가 더욱 높아질 것입니다.
체험형 및 인터랙티브 미디어로의 브랜드 예산 전환
몰입형 마케팅 서비스 시장은 미디어 기획의 지속적인 변화에도 힘입어 성장하고 있습니다. IAB 조사에 따르면 대면 및 체험형 형식에 대한 관심이 지속적으로 증가하고 있으며, 미국 광고 구매자의 41%가 2026년 중 지출을 늘릴 계획이라고 밝혔습니다. 칸터(Kantar)의 보고서에 따르면, 2025년에는 이벤트 스폰서십이 전 세계 유료 채널의 성장을 주도했습니다. 2026년 FIFA 월드컵 및 동계 올림픽은 주요 시장 전반에 걸쳐 스폰서십 활동을 더욱 활성화하는 데 기여하고 있습니다. 구매자들은 라이브 참여, 디지털 콘텐츠, 그리고 측정 가능한 시청자 반응을 결합한 형식을 원하고 있습니다. 이에 따라, 단발성 이벤트가 아닌 연계된 캠페인을 제공할 수 있는 대행사 및 기술 제공업체에 대한 몰입형 마케팅 서비스 시장 수요가 증가하고 있습니다.
높은 제작 비용과 통합의 복잡성
몰입형 마케팅 서비스 시장에서는 본격적인 프로젝트를 수행하기 위해 여전히 막대한 선행 투자가 필요합니다. 맞춤형 WebXR 환경, 디지털 트윈, 그리고 물리적·디지털 융합형 활성화에는 전문적인 제작 및 기술 리소스가 요구됩니다. 몬델리즈는 2025년 10월, AI 마케팅 콘텐츠 플랫폼에 4,000만 달러를 투자하여 광고 제작 비용을 30-50% 절감하는 것을 목표로 삼았습니다. 또한, AR 피팅 프로그램에는 커머스 플랫폼, CRM 시스템, 분석 도구와의 연동도 필요합니다. 마이크로소프트의 보고서에 따르면, 유니레버는 디지털 트윈 워크플로를 활용하여 콘텐츠 제작 기간을 수개월에서 수일로 단축하는 동시에 비용을 50% 절감했습니다. 몰입형 마케팅 서비스 시장의 많은 중견 브랜드들은 이러한 워크플로를 대규모로 전개하기 위한 사내 체계를 아직 갖추지 못하고 있습니다.
부문별 분석
2025년, 몰입형 마케팅 서비스 시장 규모의 31.64%를 광고 및 브랜딩이 차지했습니다. 이러한 비중은 현장 이벤트, 디지털 미디어 및 매장 내 활동을 결합한 캠페인에서 광고 및 브랜딩이 확립된 역할을 반영합니다. 자동차, 가전, 명품 분야에서는 제품 발표 및 시연이 여전히 중요하며, 가상 워크어라운드(virtual walkaround)를 활용함으로써 제품 발표 및 관련 미디어 보도를 확대할 수 있습니다. 소셜 미디어 및 크리에이터 캠페인은 Snap Lens Studio와 TikTok Effect House가 제공하는 저비용 AR 도구를 통해 확대되고 있습니다. 이러한 도구를 통해 크리에이터와 대행사는 기존 제작 모델보다 더 신속하게 이펙트를 디자인하고 배포할 수 있습니다.
가상 상거래와 착용 체험은 2031년까지 연평균 성장률(CAGR) 23.07%로 확대될 것으로 예측됩니다. Genlook의 조사에 따르면, 2026년 2분기 기준, 피팅 도구를 사용한 세션에서는 장바구니 추가율이 3.1배 더 높았습니다. 이에 따라 이 형식은 소매업체에게 직접적인 수익원으로 한 걸음 더 가까워졌습니다. 브랜드가 캠페인 활동을 전환율 향상 및 반품률 감소로 연결할 수 있다면, 몰입형 마케팅 서비스 업계는 그 혜택을 누리게 될 것입니다. AI를 활용한 2D에서 3D로의 변환 기술을 통해 표준 사진으로 제품 모델을 제작할 수 있게 되어, 그동안 중소 브랜드의 활용을 제한해 왔던 자산 제작상의 제약이 완화될 것입니다.
지역별 분석
2025년, 북미는 몰입형 마케팅 서비스 시장의 38.42%를 차지했습니다. 이 지역에는 대형 브랜드 광고주, 기술에 주력하는 광고 대행사, 그리고 AR을 활용한 소셜 커머스와 게임에 익숙한 소비자들이 모여 있습니다. 미국은 주요 국내 시장으로, 월드컵 공동 개최, 동계 올림픽 스폰서십, 그리고 2026년 선거 관련 활성화 지출에 힘입고 있습니다. IAB 조사에 따르면, 미국 구매 담당자의 41%가 체험형 마케팅에 대한 지출을 늘릴 것으로 예상되며, 이는 소비재, 기술, 금융 서비스, 소매 각 분야 수요를 보여줍니다. 캐나다는 게임, 엔터테인먼트, D2C(소비자 직접 판매) 소매를 통해 기여하고 있는 반면, 멕시코는 스마트폰 보급과 월드컵의 열기에 힘입어 혜택을 보고 있습니다.
아시아태평양은 2026년부터 2031년까지 23.31%라는 지역별 최고 연평균 성장률(CAGR)을 나타낼 전망입니다. 중국에서는 알리바바의 ‘타오바오’나 바이트댄스의 ‘Douyin’과 같은 플랫폼을 통해 AR 커머스의 기반이 성숙해지고 있습니다. 한국에서는 광범위한 5G 보급으로 인해 저지연 WebXR 및 공간 컴퓨팅 경험이 뒷받침되고 있습니다. 인도는 젊은 소비자층, 네트워크 접근성 확대, 그리고 가상 피팅 보급률이 낮은 점을 배경으로 아시아태평양에서 가장 높은 국가별 CAGR을 나타낼 것으로 예측됩니다. 또한, 인도의 ‘디지털 개인 데이터 보호법’은 몰입형 마케팅 서비스 시장 내 생체 인증 데이터 및 시선 데이터의 취급에도 영향을 미치고 있습니다.
2026년, 유럽은 전 세계 체험형 마케팅 지출의 26%를 차지했으며, 영국, 독일, 프랑스가 주도적인 역할을 했습니다. 영국의 광고 대행사 기반과 고급 소매업의 활성화, 그리고 독일의 전시회 문화가 고품질의 AR 프로그램과 디지털 트윈을 활용한 전시를 뒷받침하고 있습니다. 프랑스와 스페인의 중요성도 높아지고 있으며, 잭 모튼(Jack Morton)사는 2026년 3월 바르셀로나에 이베리아 사무소를 개설했습니다. 남미, 중동 및 아프리카는 여전히 시장 규모가 작지만, 스포츠, 관광, 모바일 인터넷 접근성, 그리고 D2C(소비자 직접 판매) 소매의 발전을 통해 장기적인 기회를 제공합니다.
기타 혜택 :
- 엑셀 형식 시장 예측(ME) 시트
- 3개월간의 애널리스트 지원
자주 묻는 질문
목차
제1장 서론
제2장 조사 방법
제3장 개요
제4장 시장 구도
제5장 시장 규모 및 성장 예측
제6장 경쟁 구도
제7장 시장 기회 및 향후 전망
KTH 26.09.02According to Mordor Intelligence, the immersive marketing services market size is projected to expand from USD 3.87 billion in 2025 and USD 4.62 billion in 2026 to USD 11.28 billion by 2031, registering a CAGR of 19.55% between 2026 to 2031.
This report is Segmented by Application (Virtual Commerce and Try-On Experiences, Product Launches and Demonstrations, Social Media and Creator Campaign, and More), End-Use Industry (Retail and E-Commerce, Automotive, Media and Entertainment, Travel and Hospitality, Real Estate, Healthcare, Sports and Fitness, and More), and Geography. The Market Forecasts are Provided in Terms of Value (USD).
Global Immersive Marketing Services Market Trends and Insights
Rising Demand for Participatory Brand Engagement
The immersive marketing services market is benefiting as advertisers seek active forms of brand engagement. SugarXR reported that products with AR or 3D content converted 94% higher than products without it, while average AR dwell time was 4x longer than video engagement. The IAB reported that 41% of U.S. advertising buyers expected to increase in-person and experiential spending in 2026. Kantar identified sponsored events as the fastest-growing paid channel in 2025, with a net 22% of marketers shifting budget allocation toward them. Participation also allows brands to collect first-party behavioral signals at the moment of interaction. That capability becomes more valuable as third-party signals decline across browsers and mobile environments.
Brand Budget Shift Toward Experiential and Interactive Media
The immersive marketing services market is also supported by a more durable shift in media planning. The IAB documented continued interest in in-person and experiential formats, with 41% of U.S. buyers planning higher spending during 2026. Kantar reported that event sponsorships led paid-channel growth globally in 2025. The 2026 FIFA World Cup and Winter Olympics are supporting additional sponsorship activation across major markets. Buyers are seeking formats that combine live participation, digital content, and measurable audience response. This creates more demand in the immersive marketing services market for agencies and technology providers that can deliver connected campaigns rather than isolated events.
High Production Costs and Integration Complexity
The immersive marketing services market still requires substantial upfront spending for full-scale projects. Custom WebXR environments, digital twins, and physical-digital activations need specialized production and technical resources. Mondelez invested USD 40 million in an AI marketing content platform in October 2025 and targeted advertising production cost reductions of 30-50%. AR try-on programs also need connections to commerce platforms, CRM systems, and analytics tools. Microsoft reported that Unilever used digital-twin workflows to reduce content-production timelines from months to days and costs by 50%. Many mid-market brands in the immersive marketing services market do not yet have the internal capability to deploy these workflows at scale.
Other drivers and restraints analyzed in the detailed report include:
- AR-Enabled Commerce and Virtual Try-On Adoption
- Social Platforms and Creator Tools Normalize Immersive Campaigns
- ROI Measurement Standards Remain Immature
For complete list of drivers and restraints, kindly check the Table Of Contents.
Segment Analysis
Advertising and branding held 31.64% of the immersive marketing services market size in 2025. Its position reflects an established role in campaigns that combine physical events, digital media, and in-store activity. Product launches and demonstrations remain important in automotive, consumer electronics, and luxury goods, where virtual walk-arounds can extend product reveals and related media coverage. Social media and creator campaigns have expanded with lower-cost AR tools from Snap Lens Studio and TikTok Effect House. These tools let creators and agencies design and distribute effects more quickly than earlier production models.
Virtual commerce and try-on experiences are projected to expand at a CAGR of 23.07% through 2031. Genlook recorded a 3.1x add-to-cart difference for sessions that used try-on tools in the second quarter of 2026. This has moved the format closer to a direct revenue tool for retailers. The immersive marketing services industry benefits when brands can connect campaign activity to conversion and return reduction. AI-powered 2D-to-3D conversion can create product models from standard photography, reducing an asset-production constraint that previously limited use among smaller brands.
Complete Report Scope:
- By Application
- Advertising and Branding
- Product Launches and Demonstrations
- Social Media and Creator Campaigns
- Virtual Commerce and Try-On Experiences
- By End-use Industry
- Retail and E-commerce
- Automotive
- Media and Entertainment
- Travel and Hospitality
- Real Estate
- Healthcare
- Education
- BFSI
- Sports and Fitness
- By Geography
- North America
- United States
- Canada
- Mexico
- South America
- Brazil
- Argentina
- Chile
- Rest of South America
- Europe
- Germany
- United Kingdom
- France
- Italy
- Spain
- Russia
- Rest of Europe
- Asia-Pacific
- China
- Japan
- India
- South Korea
- Australia
- Singapore
- Indonesia
- Rest of Asia-Pacific
- Middle East
- United Arab Emirates
- Saudi Arabia
- Turkey
- Qatar
- Rest of Middle East
- Africa
- South Africa
- Egypt
- Nigeria
- Kenya
- Rest of Africa
- North America
Geography Analysis
North America held 38.42% of the immersive marketing services market in 2025. The region combines large brand advertisers, technology-focused agencies, and consumers familiar with AR social commerce and gaming. The United States is the main national market, supported by World Cup co-hosting, Winter Olympics sponsorships, and election-related activation spending in 2026. The IAB finding that 41% of U.S. buyers expected to increase experiential spending indicates demand across consumer goods, technology, financial services, and retail. Canada contributes through gaming, entertainment, and direct-to-consumer retail, while Mexico benefits from smartphone adoption and World Cup momentum.
Asia-Pacific is projected to record the fastest regional CAGR at 23.31% from 2026 to 2031. China has a mature AR commerce base through Alibaba's Taobao and ByteDance's Douyin platforms. South Korea's broad 5G coverage supports low-latency WebXR and spatial-computing experiences. India is projected to post the highest national CAGR in Asia-Pacific, supported by a young consumer base, rising network access, and low virtual try-on penetration. India's Digital Personal Data Protection Act is also shaping the handling of biometric and gaze data in the immersive marketing services market.
Europe accounted for 26% of broader global experiential marketing spending in 2026, led by the United Kingdom, Germany, and France. The United Kingdom's agency base, luxury retail activity, and Germany's trade-fair culture support high-production AR programs and digital-twin-enabled exhibits. France and Spain are gaining importance, with Jack Morton opening an Iberia office in Barcelona in March 2026. South America, the Middle East, and Africa remain smaller but offer longer-term opportunities through sports, tourism, mobile internet access, and direct-to-consumer retail development.
- Jack Morton Worldwide, Inc.
- GMR Marketing, LLC
- NEXT/NOW LLC
- Sector 5 Digital, LLC
- Freeman Company, LLC
- Groove Jones LLC
- Rock Paper Reality
- BRC Imagination Arts, Inc.
- Momentum Worldwide
- George P. Johnson Experience Marketing
- ASTOUND Group
- Verve The Live Agency
- Opus Agency
- DEEPlocal Inc.
- Amplify
- 2Heads
- Collaborate Global
- Spiro
- 160over90 LLC
- Auditoire
Additional Benefits:
- The market estimate (ME) sheet in Excel format
- 3 months of analyst support
TABLE OF CONTENTS
1 INTRODUCTION
- 1.1 Study Assumptions and Market Definition
- 1.2 Scope of the Study
2 RESEARCH METHODOLOGY
3 EXECUTIVE SUMMARY
4 MARKET LANDSCAPE
- 4.1 Market Overview
- 4.2 Market Drivers
- 4.2.1 Rising Demand for Participatory Brand Engagement
- 4.2.2 Brand Budget Shift Toward Experiential and Interactive Media
- 4.2.3 AR-Enabled Commerce and Virtual Try-On Adoption
- 4.2.4 Social Platforms and Creator Tools Normalize Immersive Campaigns
- 4.2.5 Commerce Media and Gaming Platforms Open New Immersive Inventory
- 4.2.6 Generative AI and Digital Twins Reduce 3D Content Costs
- 4.3 Market Restraints
- 4.3.1 High Production Costs and Integration Complexity
- 4.3.2 ROI Measurement Standards Remain Immature
- 4.3.3 Biometric and Gaze-Tracking Compliance Risk
- 4.3.4 Browser and Device Fragmentation for WebAR and WebXR Deployment
- 4.4 Industry Value-Chain Analysis
- 4.5 Regulatory Landscape
- 4.6 Technological Outlook
- 4.7 Impact of Macroeconomic Factors on the Market
- 4.8 Porter's Five Forces Analysis
- 4.8.1 Threat of New Entrants
- 4.8.2 Bargaining Power of Buyers
- 4.8.3 Bargaining Power of Suppliers
- 4.8.4 Threat of Substitutes
- 4.8.5 Intensity of Competitive Rivalry
5 MARKET SIZE AND GROWTH FORECASTS (VALUE)
- 5.1 By Application
- 5.1.1 Advertising and Branding
- 5.1.2 Product Launches and Demonstrations
- 5.1.3 Social Media and Creator Campaigns
- 5.1.4 Virtual Commerce and Try-On Experiences
- 5.2 By End-use Industry
- 5.2.1 Retail and E-commerce
- 5.2.2 Automotive
- 5.2.3 Media and Entertainment
- 5.2.4 Travel and Hospitality
- 5.2.5 Real Estate
- 5.2.6 Healthcare
- 5.2.7 Education
- 5.2.8 BFSI
- 5.2.9 Sports and Fitness
- 5.3 By Geography
- 5.3.1 North America
- 5.3.1.1 United States
- 5.3.1.2 Canada
- 5.3.1.3 Mexico
- 5.3.2 South America
- 5.3.2.1 Brazil
- 5.3.2.2 Argentina
- 5.3.2.3 Chile
- 5.3.2.4 Rest of South America
- 5.3.3 Europe
- 5.3.3.1 Germany
- 5.3.3.2 United Kingdom
- 5.3.3.3 France
- 5.3.3.4 Italy
- 5.3.3.5 Spain
- 5.3.3.6 Russia
- 5.3.3.7 Rest of Europe
- 5.3.4 Asia-Pacific
- 5.3.4.1 China
- 5.3.4.2 Japan
- 5.3.4.3 India
- 5.3.4.4 South Korea
- 5.3.4.5 Australia
- 5.3.4.6 Singapore
- 5.3.4.7 Indonesia
- 5.3.4.8 Rest of Asia-Pacific
- 5.3.5 Middle East
- 5.3.5.1 United Arab Emirates
- 5.3.5.2 Saudi Arabia
- 5.3.5.3 Turkey
- 5.3.5.4 Qatar
- 5.3.5.5 Rest of Middle East
- 5.3.6 Africa
- 5.3.6.1 South Africa
- 5.3.6.2 Egypt
- 5.3.6.3 Nigeria
- 5.3.6.4 Kenya
- 5.3.6.5 Rest of Africa
- 5.3.1 North America
6 COMPETITIVE LANDSCAPE
- 6.1 Market Concentration
- 6.2 Strategic Moves
- 6.3 Market Share Analysis
- 6.4 Company Profiles (includes Global Level Overview, Market Level Overview, Core Segments, Financials as available, Strategic Information, Market Rank/Share, Products and Services, Recent Developments)
- 6.4.1 Jack Morton Worldwide, Inc.
- 6.4.2 GMR Marketing, LLC
- 6.4.3 NEXT/NOW LLC
- 6.4.4 Sector 5 Digital, LLC
- 6.4.5 Freeman Company, LLC
- 6.4.6 Groove Jones LLC
- 6.4.7 Rock Paper Reality
- 6.4.8 BRC Imagination Arts, Inc.
- 6.4.9 Momentum Worldwide
- 6.4.10 George P. Johnson Experience Marketing
- 6.4.11 ASTOUND Group
- 6.4.12 Verve The Live Agency
- 6.4.13 Opus Agency
- 6.4.14 DEEPlocal Inc.
- 6.4.15 Amplify
- 6.4.16 2Heads
- 6.4.17 Collaborate Global
- 6.4.18 Spiro
- 6.4.19 160over90 LLC
- 6.4.20 Auditoire
7 MARKET OPPORTUNITIES AND FUTURE OUTLOOK
- 7.1 White-space and unmet-need assessment


