

|
시장보고서
상품코드
2123149
물류대행 시장 : 시장 점유율 분석, 업계 동향 및 통계, 성장 예측(2026-2031년)Freight Forwarding - Market Share Analysis, Industry Trends & Statistics, Growth Forecasts (2026 - 2031) |
||||||
 Mordor Intelligence
Mordor Intelligence에 의하면, 물류대행 시장 규모는 2025년 5,722억 5,000만 달러로 평가되었고, 2026년에는 6,025억 8,000만 달러로 추정되고, 2026-2031년 CAGR 5.19%로 성장을 지속할 전망이며, 2031년에는 7,760억 4,000만 달러에 이를 것으로 예측됩니다.
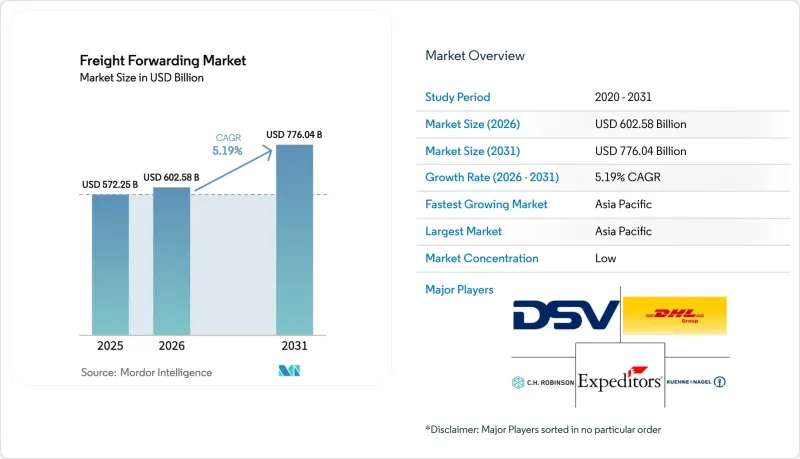
본 보고서는 운송 수단별(항공 물류대행 등), 기업 규모별(대기업 등), 포워더의 비즈니스 모델별(기존의 자산 경량형 포워더 등), 최종 사용자 산업별(소매 및 전자상거래,자동차, 화학 등) 및 지역별(북미, 남미, 유럽, 아시아태평양 등)로 분류되어 있습니다. 시장 예측은 금액(달러) 기준으로 제시되어 있습니다.
세계의 물류대행 시장 동향 및 인사이트
국경을 넘는 전자상거래 소포의 급증
세계 국경 간 소포는 2024년에 21억 개에 달한 것으로 평가되었으며, 2027년까지 30억 개를 넘어설 것으로 전망됩니다. 이에 따라 컨테이너 단위의 물류대행이 신속한 혼적을 필요로 하는 소량 화물로 세분화되고 있습니다. 현재 각 물류대행 업체들은 동남아시아에서 48시간 이내 배송 시간을 유지하기 위해 소포 허브 구축 및 라스트 마일 부문에서의 제휴를 추진하고 있습니다. 세계관세기구(WCO)의 국경 간 전자상거래 기준 등 규제 프레임워크에 따라, 통관 지연을 단축하는 자동 관세 계산 시스템에 대한 투자가 촉진되고 있습니다. 실시간 재고 가시성을 제공하지 못하는 사업자는 디지털 네이티브 경쟁사에게 시장 점유율을 빼앗길 위험이 있습니다. 따라서 물류대행 시장은 비용과 속도를 동시에 최적화할 수 있는 유연하고 데이터 활용에 능숙한 사업자로 기울고 있습니다.
엔드투엔드 운송 가시화 도입
2025년 초까지 해상 무역 분야에서 1,200만 개 이상의 IoT 컨테이너 센서가 가동되어, 항만 혼잡 및 통관 지연을 예측하는 컨트롤 타워 플랫폼에 데이터를 제공하게 되었습니다. 머신러닝을 통한 분석을 통해 화주는 지연이 심각해지기 전에 화물의 경로를 변경할 수 있게 됩니다. 이는 온도 관리가 필요한 의약품 운송 경로에서 체류료를 절감할 수 있는 이점이 됩니다. 블록체인을 활용한 선하증권은 신용장(L/C) 처리 기간을 단축하고 서류 위조를 방지하지만, 운송업체와 세관 간의 상호 운용성이 요구되기 때문에 보급 속도는 둔화되고 있습니다. 이러한 도구를 통합한 포워더는 신뢰성을 높여 물류대행 시장에서 프리미엄 요금을 확보하고 있습니다.
항만 혼잡과 컨테이너 수급 불균형
로스앤젤레스 및 롱비치 항구의 평균 체류 일수는 2023년 4.8일에서 2025년 초에는 6.2일로 증가했습니다. 한편, 빈 컨테이너 재배치 비용은 2024년에 22% 상승했습니다. 구조적인 불균형으로 인해 수입이 집중되는 지역에서는 컨테이너가 과잉 공급되고, 수출 지역에서는 부족 현상이 발생하여 체류료가 상승하고 있습니다. 내륙 데포 및 컨테이너 공유 협정을 통해 일부 비용은 경감되고 있으나, 섀시 부족과 철도 야드의 혼잡은 여전히 뿌리 깊은 병목 현상으로 남아 있어 물류대행 시장에 큰 부담을 주고 있습니다.
부문별 분석
해상 물류대행은 주요 항로에서의 높은 비용 효율성을 바탕으로 2025년에도 물류대행 시장 점유율의 61.77%를 유지했습니다. 그러나 화주들이 속도, 비용, 탄소 배출의 균형을 모색함에 따라, 멀티모달 및 인터모달 물류대행은 연평균 성장률(CAGR) 6.40%(2026년-2031년)로 확대되고 있습니다. 전자상거래의 세분화에 따라 LCL(소량 화물) 처리량이 증가하고 있으며, 화물 집하 및 혼적의 복잡성이 커지고 있습니다. 육상 운송은 라스트 마일 거점을 연결하고 있지만, 운전기사 부족과 연료 가격 변동으로 인해 인프라가 잘 갖춰진 지역에서는 내륙 운송이 철도로 전환되고 있습니다. 항공 운송은 반도체 및 의약품 공급망을 뒷받침하고 있지만, 운송 능력의 제한과 탄소 배출량에 따른 추가 요금이 성장을 저해하고 있습니다. ‘중국·유럽 철도 특급’과 같은 철도 회랑은 15-20일의 운송 기간을 제공하여 항공과 해운 사이의 격차를 메우고 있습니다.
물류대행 시장에서는 해상 간선 운송과 철도 또는 항공을 이용한 최종 구간을 결합하는 방식으로 네트워크 재구성이 진행되고 있어, 항공편의 높은 요금을 부담하지 않으면서도 완충 재고를 줄이고 있습니다. 디지털 기반 비용·시간 시뮬레이터는 재고 부족에 따른 벌금이나 재고 보유 비용을 바탕으로 운송 수단 선택을 지원하고 있습니다. IMO(국제해사기구)의 탄소 강도 지표에 따른 규제 압력으로 인해, 특히 긴급성이 낮은 화물의 경우 배출량이 적은 운송 수단 조합으로의 전환이 촉진되고 있습니다. 원활한 인계를 조정하고 통합된 가시성을 제공하는 포워더는 화주가 단일 운송 수단 계약에서 탈피하는 가운데 시장 점유율을 확보하고 있습니다.
2025년에는 대기업이 물류대행 수익의 68.50%를 차지했으며, 취급 물량을 바탕으로 계약 운임 협상을 진행했으나, 디지털 도구를 통해 접근성이 민주화됨에 따라 중소기업은 연평균 성장률(CAGR) 6.53%(2026년-2031년)로 성장하고 있습니다. 기존에는 중소기업이 경쟁력 있는 가격을 확보하거나 복잡한 통관 절차를 관리할 만한 규모가 부족했습니다. Flexport와 같은 플랫폼은 분산된 수요를 집약하고, 즉시 견적을 제공하며, 서류 작성을 자동화함으로써 중개업자에 대한 의존도를 해소하고 중소기업의 더 빠른 사업 확장을 지원하고 있습니다.
물류대행 시장이 진화함에 따라, 대규모 화주들은 여전히 맞춤형 솔루션과 전담 계정 팀을 중시하고 있지만, 기존 서비스를 평가하기 위해 디지털 대시보드의 시범 도입도 진행하고 있습니다. 이를 통해 두 가지 계층으로 구성된 동향이 뚜렷이 드러나고 있습니다. 중소기업은 투명성과 속도를 중시하는 반면, 대규모 고객은 관계의 지속성을 우선시합니다. 셀프 서비스 포털과 세심한 전문 지식을 모두 제공하는 사업자는 이 두 가지 측면을 모두 충족시키며, 서비스 품질을 저하시키지 않고 새로운 취급 물량을 확보할 수 있습니다.
지역별 분석
2025년, 아시아태평양은 물류대행 수익의 36.49%를 차지한 것으로 평가되었으며, 2026-2031년 연평균 성장률(CAGR) 7.80%로 성장할 것으로 전망되어, 이는 물류대행 시장에서 가장 빠른 지역적 성장세를 보일 것입니다. 중국은 여전히 최대의 단일 출하지이지만, ‘차이나 플러스 원(China Plus One)’에 따른 다각화 흐름 속에서 베트남, 인도, 인도네시아에 대한 투자가 증가하고 있습니다. 싱가포르와 홍콩은 뛰어난 항만 효율성과 무역 금융 생태계를 바탕으로 지역 내 집약화를 주도하고 있습니다. 일본과 한국은 고부가가치 전자제품 및 자동차 부품을 수출하고 있으며, 호주는 벌크 상품을 수출하는 한편 전자상거래를 통한 수입도 받아들이고 있습니다.
북미는 여전히 수입 중심의 목적지이지만, 만성적인 항만 혼잡과 노동력 부족으로 인해 하역 비용이 상승하고 있습니다. 화주들은 멕시코만 연안이나 동부 해안의 관문으로 우회하거나, USMCA 규정에 따라 멕시코를 경유하는 국경을 넘는 철도 운송을 확대되고 있습니다. 캐나다의 물류대행 흐름은 에너지 및 자동차 무역과 연동되어 있으며, 멕시코는 전자기기 및 자동차 생산의 일부를 아시아에서 이전하는 니어쇼어링의 혜택을 받고 있습니다.
유럽에는 독일, 네덜란드, 영국을 중심으로 한 성숙한 물류대행 거점이 있습니다. 브렉시트로 인한 통관 마찰과 창고 인력 부족이 성장을 둔화시키고 있습니다. 스칸디나비아 및 중동유럽은 의약품이나 자동차 부품 등 전문 분야의 운송 경로를 통해 틈새 운송 물량을 확보하고 있습니다. 남미, 중동 및 아프리카의 점유율은 작지만, 인프라 정비와 무역 협정에 따른 연결성 개선에 힘입어 물류대행 시장은 확대되고 있습니다.
기타 혜택 :
- 엑셀 형식 시장 예측(ME) 시트
- 3개월간의 애널리스트 지원
자주 묻는 질문
목차
제1장 서론
제2장 조사 방법
제3장 주요 요약
제4장 시장 구도
제5장 시장 규모 및 성장 예측
제6장 경쟁 구도
제7장 시장 기회 및 향후 전망
AJY 26.09.07According to Mordor Intelligence, the freight forwarding market size is expected to grow from USD 572.25 billion in 2025 to USD 602.58 billion in 2026 and is forecast to reach USD 776.04 billion by 2031 at 5.19% CAGR over 2026-2031.
This report is Segmented by Mode of Transport (Air Freight Forwarding and More), Enterprise Size (Large Enterprises and More), Forwarder Model (Traditional Asset-Light Forwarders and More), End-User Industry (Retail & E-Commerce, Automotive, Chemicals, and More), and Geography (North America, South America, Europe, Asia-Pacific, and More). The Market Forecasts are Provided in Terms of Value (USD).
Global Freight Forwarding Market Trends and Insights
Cross-Border E-Commerce Parcel Boom
Global cross-border parcels reached 2.1 billion in 2024 and are expected to exceed 3 billion by 2027, fragmenting full-container traffic into small consignments that need rapid consolidation. Forwarders now build parcel hubs and last-mile alliances to uphold 48-hour delivery windows in Southeast Asia. Regulatory frameworks such as the World Customs Organization's cross-border e-commerce standard drive investment in automated duty calculation that trims clearance delays. Providers unable to furnish real-time inventory visibility risk displacement by digital-native competitors. The freight forwarding market is therefore tilting toward flexible, data-rich operators that can optimize cost and speed simultaneously.
End-to-End Shipment Visibility Adoption
More than 12 million IoT container sensors were active in ocean trade by early 2025, feeding control-tower platforms that predict port congestion and customs holds. Machine-learning analytics help shippers re-route cargo before delays escalate, an advantage that cuts detention fees in temperature-sensitive pharma lanes. Blockchain bills of lading shorten letter-of-credit cycles and deter documentation fraud, yet widespread adoption is slowed by the need for carrier and customs interoperability. Forwarders that integrate these tools enhance trust and command premium rates in the freight forwarding market.
Port Congestion and Container Imbalances
Average dwell times at Los Angeles and Long Beach climbed to 6.2 days in early 2025, up from 4.8 days in 2023, while empty-container repositioning costs rose 22% in 2024. Structural imbalances create surplus boxes in import-heavy regions and scarcity in export zones, driving up detention fees. Inland depots and container-sharing pacts mitigate some expense, yet chassis shortages and rail yard congestion remain persistent bottlenecks that weigh on the freight forwarding market.
Other drivers and restraints analyzed in the detailed report include:
- Near-Shoring and China-Plus-One Trade Shifts
- Cold-Chain Investment for Pharma and Food
- Global Driver and Warehouse Labor Shortage
For complete list of drivers and restraints, kindly check the Table Of Contents.
Segment Analysis
Ocean freight forwarding retained a 61.77% freight forwarding market share in 2025, driven by cost efficiency on dense lanes. Yet multimodal and intermodal forwarding is advancing at a 6.40% CAGR (2026-2031) as shippers balance speed, cost, and carbon impact. Less-than-container load volumes increase with e-commerce fragmentation, widening consolidation complexity. Road forwarding connects last-mile nodes, but driver shortages and fuel volatility tilt inland moves toward rail where infrastructure allows. Air forwarding protects semiconductor and pharmaceutical supply lines, although capacity caps and carbon surcharges temper growth. Rail corridors such as the China-Europe Railway Express offer 15- to 20-day transits that fill the gap between air and ocean.
The freight forwarding market is restructuring networks to blend ocean trunk haul with rail or air final legs, reducing buffer inventory without incurring full air premiums. Digital cost-time simulators guide mode selection based on stockout penalties and inventory carrying costs. Regulatory pressure from the IMO Carbon Intensity Indicator spurs modal shifts toward lower-emission combinations, especially for non-urgent cargo. Forwarders that orchestrate seamless handoffs and provide unified visibility capture share as shippers exit single-mode contracts.
Large enterprises contributed 68.50% of forwarding revenue in 2025, leveraging volume to negotiate contract rates, but SMEs are expanding at a 6.53% CAGR (2026-2031) as digital tools democratize access. Historically, SMEs lacked the scale to secure competitive pricing or manage customs intricacies. Platforms such as Flexport aggregate fragmented demand, provide instant quotes, and automate documentation, removing broker dependency and helping SMEs expand faster.
As the freight forwarding market evolves, large shippers still prize tailored solutions and account teams, yet they pilot digital dashboards to benchmark incumbent service. A two-tier dynamic emerges: SMEs value transparency and speed, whereas large accounts prioritize relationship continuity. Providers that deliver self-service portals alongside white-glove expertise can span both clusters, capturing incremental volumes without diluting service quality.
Complete Report Scope:
- By Mode of Transport
- Ocean Freight Forwarding
- Full Container Load (FCL)
- Less-Than-Container Load (LCL)
- Road Freight Forwarding
- Full Truck Load (FTL)
- Less-Than-Truck Load (LTL)
- Air Freight Forwarding
- Rail Freight Forwarding
- Multimodal and Intermodal Forwarding
- Ocean Freight Forwarding
- By Enterprise Size
- Small and Medium Enterprises
- Large Enterprises
- By Forwarder Model
- Traditional Asset-Light Forwarders
- Digital-First / Online Platforms
- Hybrid Asset-Enabled Forwarders
- By End-user Industry
- Industrial and Manufacturing
- Retail and E-commerce
- Healthcare and Pharmaceuticals
- Oil, Gas and Energy
- Food and Beverages
- Automotive
- Chemicals
- Other End-users
- By Geography
- North America
- United States
- Canada
- Mexico
- South America
- Brazil
- Argentina
- Chile
- Rest of South America
- Europe
- Germany
- United Kingdom
- France
- Spain
- Italy
- Netherlands
- Russia
- Rest of Europe
- Asia-Pacific
- China
- India
- Japan
- South Korea
- Singapore
- Vietnam
- Indonesia
- Australia
- Rest of Asia-Pacific
- Middle East and Africa
- Saudi Arabia
- United Arab Emirates
- Turkey
- South Africa
- Nigeria
- Egypt
- Rest of Middle East and Africa
- North America
Geography Analysis
Asia-Pacific generated 36.49% of forwarding revenue in 2025 and is set to grow at a 7.80% CAGR between 2026-2031, the quickest regional climb in the freight forwarding market. China remains the largest single origin, yet Vietnam, India, and Indonesia collect rising investment under China-plus-one diversification. Singapore and Hong Kong anchor regional consolidations thanks to superior port efficiency and trade finance ecosystems. Japan and South Korea ship high-value electronics and automotive parts, while Australia ships bulk commodities and absorbs e-commerce imports.
North America remains an import-heavy destination, but chronic port congestion and labor scarcity inflate handling costs. Shippers divert to Gulf and East Coast gateways and expand cross-border rail through Mexico under USMCA provisions. Canada's forwarding flows align with energy and automotive trade, while Mexico benefits from near-shoring that relocates parts of electronics and auto production from Asia.
Europe holds a mature forwarding base centered on Germany, the Netherlands, and the United Kingdom. Brexit-induced customs friction and warehouse labor shortages moderate growth. Scandinavia and Central and Eastern Europe gain niche volumes through specialized corridors such as pharma and automotive parts. South America, the Middle East, and Africa account for smaller slices but rise as infrastructure upgrades and trade pacts improve connectivity, enlarging the freight forwarding market.
- A.P. Moller - Maersk
- C.H. Robinson
- CIMC Wetrans Logistics
- CMA CGM Group (including CEVA Logistics)
- DACHSER
- DHL Group
- DSV A/S
- Expeditors International of Washington, Inc.
- FedEx
- GEODIS
- Hellmann Worldwide Logistics
- Kerry Logistics Network, Ltd.
- Kintetsu World Express
- Kuehne+Nagel
- Lineage, Inc.
- LX Pantos
- Nippon Express Co., Ltd.
- Rhenus Logistics
- Sinotrans, Ltd.
- Toll Group
- Uber Freight LLC
- United Parcel Service of America, Inc.
- XPO, Inc.
- Yusen Logistics Co., Ltd.
Additional Benefits:
- The market estimate (ME) sheet in Excel format
- 3 months of analyst support
TABLE OF CONTENTS
1 Introduction
- 1.1 Study Assumptions and Market Definition
- 1.2 Scope of the Study
2 Research Methodology
3 Executive Summary
4 Market Landscape
- 4.1 Market Overview
- 4.2 Market Drivers
- 4.2.1 Cross-Border E-Commerce Parcel Boom
- 4.2.2 End-to-End Shipment-Visibility Adoption
- 4.2.3 Near-Shoring and "China-Plus-One" Trade Shifts
- 4.2.4 Cold-Chain Investment for Pharma and Food
- 4.2.5 Shipper ESG Targets and Carbon-Pricing Demand
- 4.2.6 Generative-AI Dynamic Load-Matching
- 4.3 Market Restraints
- 4.3.1 Port Congestion and Container Imbalances
- 4.3.2 Global Driver and Warehouse-Labor Shortage
- 4.3.3 Geopolitical Flashpoints and Route Risk
- 4.3.4 Tightening De-Minimis Thresholds and Compliance Burden
- 4.4 Value / Supply-Chain Analysis
- 4.5 Regulatory Landscape
- 4.6 Technological Outlook
- 4.7 Porter's Five Forces Analysis
- 4.7.1 Threat of New Entrants
- 4.7.2 Bargaining Power of Buyers
- 4.7.3 Bargaining Power of Suppliers
- 4.7.4 Threat of Substitutes
- 4.7.5 Intensity of Competitive Rivalry
- 4.8 Pricing Analysis
- 4.9 Impact of Geopolitical Events
5 Market Size and Growth Forecasts (Value)
- 5.1 By Mode of Transport
- 5.1.1 Ocean Freight Forwarding
- 5.1.1.1 Full Container Load (FCL)
- 5.1.1.2 Less-Than-Container Load (LCL)
- 5.1.2 Road Freight Forwarding
- 5.1.2.1 Full Truck Load (FTL)
- 5.1.2.2 Less-Than-Truck Load (LTL)
- 5.1.3 Air Freight Forwarding
- 5.1.4 Rail Freight Forwarding
- 5.1.5 Multimodal and Intermodal Forwarding
- 5.1.1 Ocean Freight Forwarding
- 5.2 By Enterprise Size
- 5.2.1 Small and Medium Enterprises
- 5.2.2 Large Enterprises
- 5.3 By Forwarder Model
- 5.3.1 Traditional Asset-Light Forwarders
- 5.3.2 Digital-First / Online Platforms
- 5.3.3 Hybrid Asset-Enabled Forwarders
- 5.4 By End-user Industry
- 5.4.1 Industrial and Manufacturing
- 5.4.2 Retail and E-commerce
- 5.4.3 Healthcare and Pharmaceuticals
- 5.4.4 Oil, Gas and Energy
- 5.4.5 Food and Beverages
- 5.4.6 Automotive
- 5.4.7 Chemicals
- 5.4.8 Other End-users
- 5.5 By Geography
- 5.5.1 North America
- 5.5.1.1 United States
- 5.5.1.2 Canada
- 5.5.1.3 Mexico
- 5.5.2 South America
- 5.5.2.1 Brazil
- 5.5.2.2 Argentina
- 5.5.2.3 Chile
- 5.5.2.4 Rest of South America
- 5.5.3 Europe
- 5.5.3.1 Germany
- 5.5.3.2 United Kingdom
- 5.5.3.3 France
- 5.5.3.4 Spain
- 5.5.3.5 Italy
- 5.5.3.6 Netherlands
- 5.5.3.7 Russia
- 5.5.3.8 Rest of Europe
- 5.5.4 Asia-Pacific
- 5.5.4.1 China
- 5.5.4.2 India
- 5.5.4.3 Japan
- 5.5.4.4 South Korea
- 5.5.4.5 Singapore
- 5.5.4.6 Vietnam
- 5.5.4.7 Indonesia
- 5.5.4.8 Australia
- 5.5.4.9 Rest of Asia-Pacific
- 5.5.5 Middle East and Africa
- 5.5.5.1 Saudi Arabia
- 5.5.5.2 United Arab Emirates
- 5.5.5.3 Turkey
- 5.5.5.4 South Africa
- 5.5.5.5 Nigeria
- 5.5.5.6 Egypt
- 5.5.5.7 Rest of Middle East and Africa
- 5.5.1 North America
6 Competitive Landscape
- 6.1 Market Concentration
- 6.2 Strategic Moves
- 6.3 Market Share Analysis
- 6.4 Company Profiles (includes Global level Overview, Market level overview, Core Segments, Financials as available, Strategic Information, Market Rank/Share for key companies, Products and Services, Recent Developments)
- 6.4.1 A.P. Moller - Maersk
- 6.4.2 C.H. Robinson
- 6.4.3 CIMC Wetrans Logistics
- 6.4.4 CMA CGM Group (including CEVA Logistics)
- 6.4.5 DACHSER
- 6.4.6 DHL Group
- 6.4.7 DSV A/S
- 6.4.8 Expeditors International of Washington, Inc.
- 6.4.9 FedEx
- 6.4.10 GEODIS
- 6.4.11 Hellmann Worldwide Logistics
- 6.4.12 Kerry Logistics Network, Ltd.
- 6.4.13 Kintetsu World Express
- 6.4.14 Kuehne+Nagel
- 6.4.15 Lineage, Inc.
- 6.4.16 LX Pantos
- 6.4.17 Nippon Express Co., Ltd.
- 6.4.18 Rhenus Logistics
- 6.4.19 Sinotrans, Ltd.
- 6.4.20 Toll Group
- 6.4.21 Uber Freight LLC
- 6.4.22 United Parcel Service of America, Inc.
- 6.4.23 XPO, Inc.
- 6.4.24 Yusen Logistics Co., Ltd.
7 Market Opportunities and Future Outlook
- 7.1 White-space and Unmet-need Assessment


