
|
시장보고서
상품코드
2072574
이더넷 스위치 : 시장 점유율 분석, 업계 동향 및 통계, 성장 예측(2026-2031년)Ethernet Switch - Market Share Analysis, Industry Trends & Statistics, Growth Forecasts (2026 - 2031) |
||||||
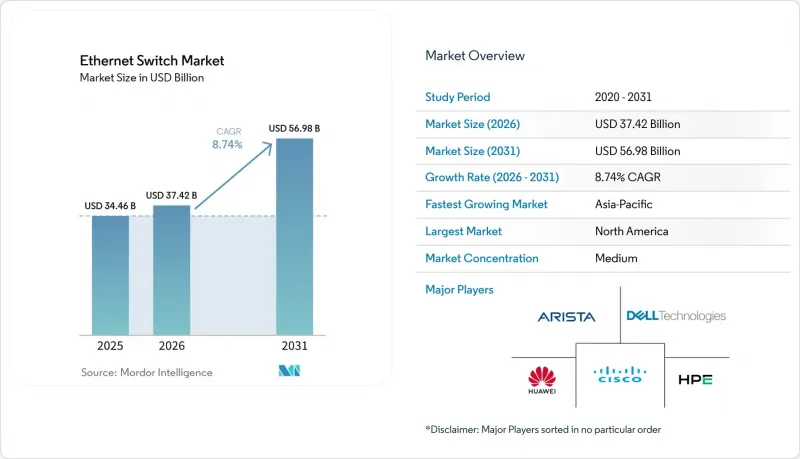
Mordor Intelligence에 의하면, 이더넷 스위치 시장 규모는 2025년 344억 6,000만 달러로 평가되었습니다. 2026년에는 374억 2,000만 달러로 확대되어 2031년까지 569억 8,000만 달러에 이를 것으로 예상되고 2026년부터 2031년에 걸쳐 CAGR 8.74%로 성장할 전망입니다.
본 보고서는 스위치 유형(고정 구성 스위치 및 모듈형 스위치), 포트 속도(1 GbE 이하, 2.5/5GbE, 10 GbE, 기타), 최종 사용자(클라우드 및 데이터센터 제공업체, 기업(상업용 사무실 및 캠퍼스), 기타), 관리 유형(스마트/웹 관리형 스위치, 비관리형 스위치, 기타) 및 지역별로 분류되어 있습니다. 시장 전망은 금액(달러) 기준으로 제시되어 있습니다.
세계의 이더넷 스위치 시장 동향 및 분석
AI 워크로드로 인한 대역폭 수요 증가
생성형 AI 훈련 클러스터에는 기존의 100기가비트 장비로는 충족할 수 없는 저지연 패브릭이 필요합니다. 2025년 12월부터 가동 중인 메타(Meta)의 슈퍼컴퓨터 ‘프로메테우스(Prometheus)’는 GPU를 초당 800기가비트 속도로 작동하는 NVIDIA Spectrum-X 스위치에 연결했으며, 이는 이더넷이 인피니밴드(InfiniBand)에 비해 비용 면에서 우위를 점하고 있음을 보여줍니다. Oracle Cloud도 2025년에 이에 발맞추어, 해당 플랫폼에 통합된 적응형 라우팅을 통해 처리량이 1.6배 향상되었다고 밝혔습니다. 각 하이퍼스케일러 기업들은 현재 1 : 1의 오버구독 비율을 목표로 하고 있으며, 이로 인해 랙당 포트 수가 실질적으로 두 배로 늘어날 것입니다. NVIDIA는 자사의 DGX SuperPOD 아키텍처의 용량을 확보하기 위해 Marvell사와 20억 달러 상당의 맞춤형 스위치 ASIC 공급 계약을 체결했습니다. AI 클러스터의 전력 소비량이 1GW를 넘는 규모로 확대됨에 따라, 신규 구축 시 스파인-앤-리프 구성의 표준 옵션으로 800G 이더넷이 부상하고 있습니다.
클라우드 데이터센터의 급증
각 하이퍼스케일러 기업의 설비 투자는 계속해서 급증하고 있으며, 주요 지역마다 수십억 달러 규모의 캠퍼스 건설이 착공되고 있습니다. 2025년에 발표된 구글의 Virgo AI 클러스터에서는 가용성 영역을 가로질러 맞춤형 800기가비트 스위치를 연쇄적으로 연결하여 텐서 처리 유닛 간의 지연 시간을 줄이고 있습니다. 마이크로소프트가 아랍에미리트에 건설할 5GW 규모의 시설에 152억 달러를 투자하기로 한 결정은 액체 냉각을 통해 랙의 고밀도화가 가능해짐에 따라, 그 결과, 스파인 1대당 800기가비트 이더넷 포트를 576개 집약할 수 있는 모듈형 섀시가 필요함을 여실히 보여주고 있습니다. SONiC와 같은 오픈 네트워킹 스택은 이러한 환경에서 급속히 보급되고 있습니다. 마이크로소프트, 메타, 링크드인은 2024년 한 해 동안 1,000건 이상의 코드 커밋을 수행하며 기능 출시 주기를 단축했습니다.
400G 및 800G로의 업그레이드에 따른 막대한 설비 투자
64포트 800기가비트 스위치의 정가는 20만 달러에 육박하며, 광 모듈은 포트당 1,000-3,000달러가 추가로 들기 때문에 하이퍼스케일 기업을 제외한 다른 기업들의 예산에는 큰 부담이 되고 있습니다. 리니어사의 플러그인형 광 모듈은 비트당 비용을 절감하고 있습니다. 2026년 4월에 발표된 아리스타사의 XPO 모듈은 개당 12.8 Tbps의 대역폭을 제공하면서도 전력 소비를 줄이고 있습니다. 그럼에도 불구하고, 유럽의 많은 기업들은 해당 지역의 에너지 효율 관련 규제로 인해 통신 사업자들이 포트당 100기가비트 미만의 플랫폼을 채택할 수밖에 없는 상황에 처해 있어, 장비 교체를 미루고 있습니다. 사용량에 따른 리스 계약은 단기적인 현금 흐름 부담을 줄여주지만, 궁극적으로는 비용을 더 긴 기간에 걸쳐 분산시키는 결과를 초래합니다.
부문별 분석
2025년에는 고정 구성의 유닛이 출하량의 76.38%를 차지하며, 포트 수가 48개 미만인 캠퍼스 액세스 계층, 소매점, 산업 시설의 기반이 되었습니다. 모듈형 섀시는 설치 면적이 작을 뿐만 아니라, 하이퍼스케일러들이 지게차 교체 없이 라인 카드를 한 장씩 추가할 수 있는 스파인 패브릭을 요구하고 있기 때문에 연평균 성장률(CAGR) 10.18%로 성장하고 있습니다. Arista의 7800R4 플랫폼은 576개의 800G 포트를 지원하며, 230.4 Tbps의 총 처리량을 실현합니다. 2025년 12월에 출시된 Cisco의 Nexus 9800 개량 모델은 115.2 Tbps라는 동등한 최대 처리량을 달성하는 동시에 실시간 텔레메트리 기능도 갖추고 있습니다.
비용과 성능 간의 상충 관계는 여전히 구매자의 선택에 영향을 미치고 있습니다. 연평균 성장률(CAGR) 9.11%를 기록한 비관리형 고정 스위치는 관리자가 플러그 앤 플레이 방식을 선호하는 IoT 구축에 활용되고 있습니다. 스마트한 웹 관리형 스위치는 완전한 소프트웨어 정의 네트워크(SDN)를 구축하는 데 드는 비용 없이 중소기업에 VLAN 및 QoS를 도입할 수 있는 가교 역할을 합니다. 풀 매니지드 고정형 장비는 신원 인식 기반 정책 및 세분화과 통합되어 캠퍼스 코어의 기반을 형성하고 있습니다. 모듈식 방식의 도입은 앞으로도 하이퍼스케일 시장을 중심으로 이루어질 전망이지만, 중견 시장의 코로케이션 제공업체들은 예측 불가능한 AI 테넌트의 트래픽 급증에 대비해 미래를 내다본 섀시 사양 수립에 착수하고 있습니다.
비용을 중시하는 소규모 사무실 및 산업용 센서 분야에서 2025년 시점에도 레거시 1기가비트 제품은 이더넷 스위치 시장 점유율의 31.12%를 계속 차지했습니다. 한편, GPU 클러스터와 분석 파이프라인이 구형 패브릭을 압도하는 가운데, 400기가비트 이상의 부문은 연평균 성장률(CAGR) 13.63%로 성장을 지속하고, 있습니다. Meta는 Prometheus를 InfiniBand에서 적응형 라우팅 기능을 갖춘 800기가비트 이더넷으로 전환했을 때, 실효 처리량이 1.6배 향상된 것으로 나타났습니다.
멀티 기가비트급 2.5/5GbE는 Wi-Fi 7로의 전환을 위한 가교 역할을 하고 있는 반면, 10 GbE는 아직 100 GbE 도입 비용을 정당화하기 어려운 중규모 데이터센터의 백본으로서의 위상을 유지하고 있습니다. 구매자들은 25/40 GbE를 건너뛰고 직접 100 GbE로 전환하고 있으며, 이로 인해 시장 곡선의 중간 부분이 압축되고 있습니다. Arista가 2026년 4월에 발표한 XPO 광 모듈은 포트당 전력 소비를 대폭 줄여, 과거에는 100 GbE로 제한되었던 톱 오브 랙 환경에서도 800 GbE를 구현합니다. 이러한 발전으로 인해 레거시 제품 시장 점유율은 꾸준히 감소하겠지만, 산업용 엔드포인트의 롱테일 시장이 존재하기 때문에 1 GbE는 향후 10년 동안에도 계속 유지될 것입니다.
지역별 분석
2025년, 하이퍼스케일 기업들의 예산에 따라 수십억 규모의 자금이 고속 패브릭 구축에 투입된 결과, 북미는 전 세계 매출의 35.18%를 유지했습니다. 1 GW를 소비하며 800 GbE Spectrum-X 스위치로 연결된 Meta의 Prometheus 구축은 이 지역의 기술적 우위를 여실히 보여주고 있습니다. 몬트리올의 수력 발전에 따른 비용 경쟁력과 토론토 근교의 광활한 토지를 바탕으로, 캐나다는 제2의 허브로 부상하고 있습니다. 기업들이 WiFi 7로의 전환과 제로터치 캠퍼스 아키텍처 도입을 추진함에 따라, 엔터프라이즈 분야의 혁신 움직임은 견조한 추세를 보이고 있습니다. 규제 당국의 감독은 유럽에 비해 완만하지만, 미국 에너지부가 향후 발표할 예정인 기기 전력 소비에 관한 지침에 따라 장기적으로는 저전력 실리콘으로 수요 전환이 일어날 가능성이 있습니다.
아시아태평양은 가장 빠르게 성장하고 있는 지역으로, 2031년까지의 연평균 성장률(CAGR)은 10.12%로 전망됩니다. 사우디아라비아의 1,000억 달러 규모의 AI 인프라 확충 계획에는 2025년 12월에 시작된 STC와 Humain 간의 1GW 규모 데이터센터 제휴가 포함되어 있습니다. 아랍에미리트(UAE)는 마이크로소프트의 지원을 받아 5GW 규모의 캠퍼스를 건설하고, 수만 개의 400 및 800 GbE 포트를 설치할 계획이며, 이는 앞서 언급한 규모를 뛰어넘는 수준이 될 것입니다. 인도의 2급 도시에서는 2025년에 Yotta Infrastructure, CtrlS, Airtel Nxtra 등 각사가 지역 전자상거래 및 정부 업무 부하를 처리하기 위한 엣지 시설에 관한 발표를 잇달아 내놓았습니다. 중국의 화웨이와 H3C는 국내 입찰 시장을 장악하고 있지만, 수출 규제로 인해 세계 시장 진출이 가로막혀 있습니다. 일본과 한국은 자동차 및 반도체 제조 분야의 활용 사례를 주도하고 있으며, 시간 민감형 네트워킹의 도입이 점점 더 확대되고 있습니다. 호주 및 뉴질랜드에서는 광활한 지역에 걸쳐 있는 하이브리드 오피스를 연결하기 위해 구독 관리형 스위치가 선호되고 있습니다.
유럽에서는 에너지 규제가 강화됨에 따라, 특정 워크로드의 경우 통신 사업자들이 400 GbE 대신 100 GbE로 전환해야 하는 상황에 직면해 있습니다. EU의 데이터센터 행동 강령에서는 전력 사용 효율(PUE)을 1.3 미만으로 유지할 것을 권장하고 있으며, 이는 스위치 선정 기준에 직접적인 영향을 미치고 있습니다. 독일에서는 자동차 생산 라인에 IEEE 802.1DG가 도입되어 있는 반면, 영국에서는 제조용 로봇의 지연 시간 요구 사항을 충족하고 있습니다. 동유럽에서는 거시경제적 압박으로 인해 인프라 투자가 여전히 부진한 가운데, 제재의 영향을 받는 러시아 시장에서는 구식 아키텍처에 의존하고 있습니다. 남미에서는 브라질의 5G 백홀 프로젝트를 필두로 점진적인 진전이 나타나고 있는 반면, 아프리카는 아직 초기 단계에 머물러 있으며, 나이지리아와 남아프리카공화국에서는 핀테크 허브 주변에서 소규모 시설의 시범 운영이 진행되고 있습니다.
기타 혜택 :
- 엑셀 형식 시장 예측(ME) 시트
- 3개월간의 애널리스트 지원
자주 묻는 질문
목차
제1장 서론
제2장 조사 방법
제3장 주요 요약
제4장 시장 구도
제5장 시장 규모 및 성장 예측
제6장 경쟁 구도
제7장 시장 기회 및 향후 전망
KTH 26.07.03According to Mordor Intelligence, the ethernet switch market size is expected to increase from USD 34.46 billion in 2025 to USD 37.42 billion in 2026 and reach USD 56.98 billion by 2031, growing at a CAGR of 8.74% over 2026-2031.

This report is Segmented by Switch Type (Fixed Configuration Switches, and Modular Switches), Port Speed (1 GbE and Below, 2. 5/5 GbE, 10 GbE, and More), End User (Cloud and Data Center Providers, Enterprise (Commercial Offices and Campuses), and More), Management Type (Smart / Web-Managed Switches, Unmanaged Switches, and More), and Geography. The Market Forecasts are Provided in Terms of Value (USD).
Global Ethernet Switch Market Trends and Insights
Increasing Bandwidth Demand From AI Workloads
Generative-AI training clusters require low-latency fabrics that legacy 100-gigabit gear cannot satisfy. Meta's Prometheus supercomputer, online since December 2025, connects GPUs with NVIDIA Spectrum-X switches operating at 800 gigabits per second, illustrating Ethernet's cost advantage over InfiniBand. Oracle Cloud followed in 2025, citing a 1.6-times throughput gain from adaptive routing built into the same platform. Hyperscalers are now aiming for 1:1 oversubscription ratios, effectively doubling the number of ports per rack. NVIDIA locked in USD 2 billion of custom switch ASIC supply from Marvell to guarantee capacity for its DGX SuperPOD architecture. As AI clusters scale past 1 GW of power draw, 800G Ethernet emerges as the default spine-and-leaf choice for new builds.
Proliferation of Cloud Data Centers
Capital expense among hyperscalers continues to surge, with multibillion-dollar campuses breaking ground in every major region. Google's Virgo AI cluster, unveiled in 2025, chains custom 800 gigabit switches across availability zones to reduce latency between tensor-processing units. Microsoft's USD 15.2 billion commitment to a 5 GW facility in the United Arab Emirates underscores how liquid cooling enables denser racks, thereby requiring modular chassis capable of aggregating 576 ports of 800 gigabit Ethernet per spine. Open networking stacks such as SONiC are accelerating in these environments; Microsoft, Meta, and LinkedIn submitted more than 1,000 code commits during 2024, trimming feature roll-out cycles.
High CapEx for 400G and 800G Upgrades
A 64-port 800 gigabit switch lists near USD 200,000, and optics add USD 1,000-3,000 per port, straining budgets outside hyperscale circles. Linear pluggable optics are lowering per-bit cost; Arista's XPO modules announced in April 2026 deliver 12.8 Tbps each while trimming power budgets. Even so, many European enterprises defer refreshes because the region's energy-efficiency code pushes operators toward platforms under 100 gigabit per port. Consumption-based leasing eases near-term cash flow but ultimately spreads expenses across longer periods.
Other drivers and restraints analyzed in the detailed report include:
- Growth of Edge Data Centers in Tier-2 Cities
- Rising Adoption of PoE and IoT-Enabled Devices
- Semiconductor Supply Chain Disruptions
For complete list of drivers and restraints, kindly check the Table Of Contents.
Segment Analysis
Fixed configuration units dominated shipments with 76.38% share in 2025, anchoring campus access layers, retail branches, and industrial facilities where port counts hover under 48. Modular chassis, though smaller in footprint, are expanding at a 10.18% CAGR as hyperscalers demand spine fabrics that grow line cards by line card without forklift swaps. Arista's 7800R4 platform supports 576 800 G ports and delivers 230.4 Tbps of aggregate throughput. Cisco's Nexus 9800 refresh in December 2025 rivals that ceiling at 115.2 Tbps while layering in real-time telemetry.
The cost-performance trade-off continues to shape buyer choices. Unmanaged fixed switches posting 9.11% CAGR serve IoT rollouts where administrators favor plug-and-play. Smart web-managed tiers bridge small enterprises into VLAN and QoS without the cost of full software-defined networking. Fully managed fixed gear anchors campus cores, integrating with identity-aware policies and segmentation. Modular adoption will remain hyperscale-centric, but mid-market colocation providers are starting to spec chassis to future-proof against unpredictable AI tenant bursts.
Legacy 1-gigabit still claimed 31.12% of the Ethernet switch market share in 2025, amid cost-sensitive small offices and industrial sensor fields. At the opposite end, the 400-gigabit-and-above tier is charting a 13.63% CAGR as GPU clusters and analytics pipelines overwhelm older fabrics. Meta recorded 1.6X higher effective throughput when shifting Prometheus from InfiniBand to 800 gigabit Ethernet with adaptive routing.
Multi-gigabit 2.5/5 GbE is bridging the gap to WiFi 7 refreshes, while 10 GbE remains the backbone of mid-sized data centers that cannot yet cost-justify 100 GbE. Buyers are leapfrogging 25/40 GbE straight to 100 GbE, compressing the middle of the curve. Arista's April 2026 XPO optics slash per-port power draw, enabling 800 GbE in top-of-rack footprints once limited to 100 GbE. These advances will steadily erode the legacy share, though a long tail of industrial endpoints ensures 1 GbE persists well into the next decade.
Complete Report Scope:
- By Switch Type
- Fixed Configuration Switches
- Modular Switches
- By Port Speed
- 1 GbE and Below
- 2.5/5 GbE Multi-Gig
- 10 GbE
- 25/40 GbE
- 100 GbE
- 400 GbE and Above
- By End-User
- Cloud and Data Center Providers
- Enterprise (Commercial Offices and Campuses)
- Telecommunication Service Providers
- Government and Defense
- Other End-Users
- By Management Type
- Smart / Web-Managed Switches
- Unmanaged Switches
- Fully Managed Switches
- By Geography
- North America
- United States
- Canada
- Mexico
- South America
- Brazil
- Argentina
- Rest of South America
- Europe
- Germany
- United Kingdom
- France
- Italy
- Spain
- Russia
- Rest of Europe
- Asia-Pacific
- China
- Japan
- India
- South Korea
- Australia and New Zealand
- Rest of Asia-Pacific
- Middle East
- Saudi Arabia
- United Arab Emirates
- Turkey
- Rest of Middle East
- Africa
- South Africa
- Nigeria
- Rest of Africa
- North America
Geography Analysis
North America maintained 35.18% of global revenue in 2025 as hyperscale budgets funneled billions into high-speed fabric rollouts. Meta's Prometheus deployment, consuming 1 GW and stitched together by 800 GbE Spectrum-X switches, illustrates the region's technical edge. Canada is emerging as a secondary hub, given Montreal's hydro-powered cost advantages and ample land near Toronto. Enterprise refresh momentum stays steady as organizations migrate to WiFi 7 and explore zero-touch campus architectures. Regulatory scrutiny remains lighter than in Europe, yet forthcoming U.S. Department of Energy guidelines on equipment power draw could shift demand toward lower-wattage silicon over the long term.
Asia-Pacific is the fastest-rising territory, tracking 10.12% CAGR through 2031. Saudi Arabia's USD 100 billion AI capacity drive includes a 1 GW data-center partnership between STC and Humain, launched in December 2025. The United Arab Emirates tops even that with a 5 GW campus backed by Microsoft that will install tens of thousands of 400 and 800 GbE ports. India's tier-2 cities witnessed a burst of edge-facility announcements in 2025 from Yotta Infrastructure, CtrlS, and Airtel Nxtra to serve regional e-commerce and government workloads. China's Huawei and H3C dominate domestic bids, though export controls stunt global reach. Japan and South Korea anchor automotive and semiconductor manufacturing use cases, increasingly adopting time-sensitive networking. Australia and New Zealand favor subscription-managed switches to connect hybrid offices across vast geographies.
Europe confronts tighter energy rules that nudge operators toward 100 GbE rather than 400 GbE for certain workloads. The EU's Code of Conduct for Data Centers recommends power-usage effectiveness below 1.3, which directly influences switch-selection criteria. Germany is deploying IEEE 802.1DG in automotive lines, while the United Kingdom targets manufacturing robotics latency requirements. Eastern European infrastructure spending remains subdued amid macroeconomic pressures, and Russia's sanctions-constrained market relies on older architectures. South America reports incremental gains led by Brazilian 5G backhaul projects, whereas Africa is at a nascent stage with Nigeria and South Africa piloting micro-facilities around fintech hubs.
- Cisco Systems, Inc.
- Huawei Technologies Co., Ltd.
- Arista Networks, Inc.
- Hewlett Packard Enterprise Company
- Dell Technologies Inc.
- Extreme Networks, Inc.
- NETGEAR, Inc.
- Edgecore Networks Corporation
- D-Link Corporation
- TP-Link Corporation Limited
- Fortinet, Inc.
- Allied Telesis Holdings K.K.
- Alcatel-Lucent Enterprise (ALE International SAS)
- MikroTikls SIA
- Lenovo Group Limited
- NVIDIA Corporation
- Microchip Technology Inc.
- WAGO
- Edgecore Networks
- Ruijie Networks
Additional Benefits:
- The market estimate (ME) sheet in Excel format
- 3 months of analyst support
TABLE OF CONTENTS
1 INTRODUCTION
- 1.1 Study Assumptions and Market Definition
- 1.2 Scope of the Study
2 RESEARCH METHODOLOGY
3 EXECUTIVE SUMMARY
4 MARKET LANDSCAPE
- 4.1 Market Overview
- 4.2 Market Drivers
- 4.2.1 Proliferation of Cloud Data Centers
- 4.2.2 Rising Adoption of PoE and IoT-Enabled Devices
- 4.2.3 Increasing Bandwidth Demand From AI Workloads
- 4.2.4 Transition to Time-Sensitive Networking in Industry 4.0
- 4.2.5 Open Ethernet Disaggregation in Hyperscale Networks
- 4.2.6 Growth of Edge Data Centers in Tier-2 Cities
- 4.3 Market Restraints
- 4.3.1 Semiconductor Supply Chain Disruptions
- 4.3.2 High CapEx for 400G and 800G Upgrades
- 4.3.3 Alternative Fabrics (NVLink, CXL) Curtailing Port Growth
- 4.3.4 Energy-Efficiency Regulations Elevating TCO
- 4.4 Industry Value Chain Analysis
- 4.5 Regulatory Landscape
- 4.6 Technological Outlook
- 4.7 Impact of Macroeconomic Factors on the Market
- 4.8 Porter's Five Forces Analysis
- 4.8.1 Threat of New Entrants
- 4.8.2 Bargaining Power of Suppliers
- 4.8.3 Bargaining Power of Buyers
- 4.8.4 Threat of Substitutes
- 4.8.5 Competitive Rivalry
5 MARKET SIZE AND GROWTH FORECASTS (VALUE)
- 5.1 By Switch Type
- 5.1.1 Fixed Configuration Switches
- 5.1.2 Modular Switches
- 5.2 By Port Speed
- 5.2.1 1 GbE and Below
- 5.2.2 2.5/5 GbE Multi-Gig
- 5.2.3 10 GbE
- 5.2.4 25/40 GbE
- 5.2.5 100 GbE
- 5.2.6 400 GbE and Above
- 5.3 By End-User
- 5.3.1 Cloud and Data Center Providers
- 5.3.2 Enterprise (Commercial Offices and Campuses)
- 5.3.3 Telecommunication Service Providers
- 5.3.4 Government and Defense
- 5.3.5 Other End-Users
- 5.4 By Management Type
- 5.4.1 Smart / Web-Managed Switches
- 5.4.2 Unmanaged Switches
- 5.4.3 Fully Managed Switches
- 5.5 By Geography
- 5.5.1 North America
- 5.5.1.1 United States
- 5.5.1.2 Canada
- 5.5.1.3 Mexico
- 5.5.2 South America
- 5.5.2.1 Brazil
- 5.5.2.2 Argentina
- 5.5.2.3 Rest of South America
- 5.5.3 Europe
- 5.5.3.1 Germany
- 5.5.3.2 United Kingdom
- 5.5.3.3 France
- 5.5.3.4 Italy
- 5.5.3.5 Spain
- 5.5.3.6 Russia
- 5.5.3.7 Rest of Europe
- 5.5.4 Asia-Pacific
- 5.5.4.1 China
- 5.5.4.2 Japan
- 5.5.4.3 India
- 5.5.4.4 South Korea
- 5.5.4.5 Australia and New Zealand
- 5.5.4.6 Rest of Asia-Pacific
- 5.5.5 Middle East
- 5.5.5.1 Saudi Arabia
- 5.5.5.2 United Arab Emirates
- 5.5.5.3 Turkey
- 5.5.5.4 Rest of Middle East
- 5.5.6 Africa
- 5.5.6.1 South Africa
- 5.5.6.2 Nigeria
- 5.5.6.3 Rest of Africa
- 5.5.1 North America
6 COMPETITIVE LANDSCAPE
- 6.1 Market Concentration
- 6.2 Strategic Moves
- 6.3 Market Share Analysis
- 6.4 Company Profiles (includes Global Level Overview, Market Level Overview, Core Segments, Financials as available, Strategic Information, Market Rank/Share, Products and Services, Recent Developments)
- 6.4.1 Cisco Systems, Inc.
- 6.4.2 Huawei Technologies Co., Ltd.
- 6.4.3 Arista Networks, Inc.
- 6.4.4 Hewlett Packard Enterprise Company
- 6.4.5 Dell Technologies Inc.
- 6.4.6 Extreme Networks, Inc.
- 6.4.7 NETGEAR, Inc.
- 6.4.8 Edgecore Networks Corporation
- 6.4.9 D-Link Corporation
- 6.4.10 TP-Link Corporation Limited
- 6.4.11 Fortinet, Inc.
- 6.4.12 Allied Telesis Holdings K.K.
- 6.4.13 Alcatel-Lucent Enterprise (ALE International SAS)
- 6.4.14 MikroTikls SIA
- 6.4.15 Lenovo Group Limited
- 6.4.16 NVIDIA Corporation
- 6.4.17 Microchip Technology Inc.
- 6.4.18 WAGO
- 6.4.19 Edgecore Networks
- 6.4.20 Ruijie Networks
7 MARKET OPPORTUNITIES AND FUTURE OUTLOOK
- 7.1 White-Space and Unmet-Need Assessment

